
What is Zoning?

A colourful rendition of Edmonton’s Land Use Zones - Downtown and surrounding neighbourhoods. Created in QGIS using zoning data from www.data.edmonton.ca
What is zoning? I mean, besides that thing you do, during a pandemic, when the T.V. is on.
Zoning, as defined by The City of Edmonton in ‘What is Zoning? How it Shapes Your Neighbourhood and City’, “…allows City Council to set rules for where new buildings should go, what types of buildings they can be, what activities and businesses can happen there, as well as requirements for other things such as landscaping.” (pp. 4). The What is Zoning document goes on to describe the relationship between zoning and land use planning: “Zoning is the legal tool that ensures that the buildings that are built support the vision in the Land Use Plan.” (pp.11).
Zoning creates ‘zones’ or areas within a city to manage land use within that area, and avoid conflicts between conflicting land uses. For instance, there is a zone for single family homes called ‘Single Detached Residential Zone (RF1)’ which stipulates all the rules for building a single family detached home in that zone. There is also a zone for ‘Public Parks (AP)’ and for ‘Neighbourhood Convenience Commercial Zone (CNC)’. These three zones work well together because it’s desirable to have parks and conveniences such as a corner store or cafe adjacent to your home. It’s not desirable, on the other hand, to have a light industrial development, manufacturing or highway next to your home (and I will get to this exact issue in a future blog post).
And all of these zone types - and associated rules and policy - are described in the Zoning Bylaw. For example, the Neighbourhood Convenience Commercial Zone is described as:
The purpose of this Zone is to provide for convenience commercial and personal service uses, which are intended to serve the day-to-day needs of residents within residential neighbourhoods.
What does this look like on the ground (or on a map….)?
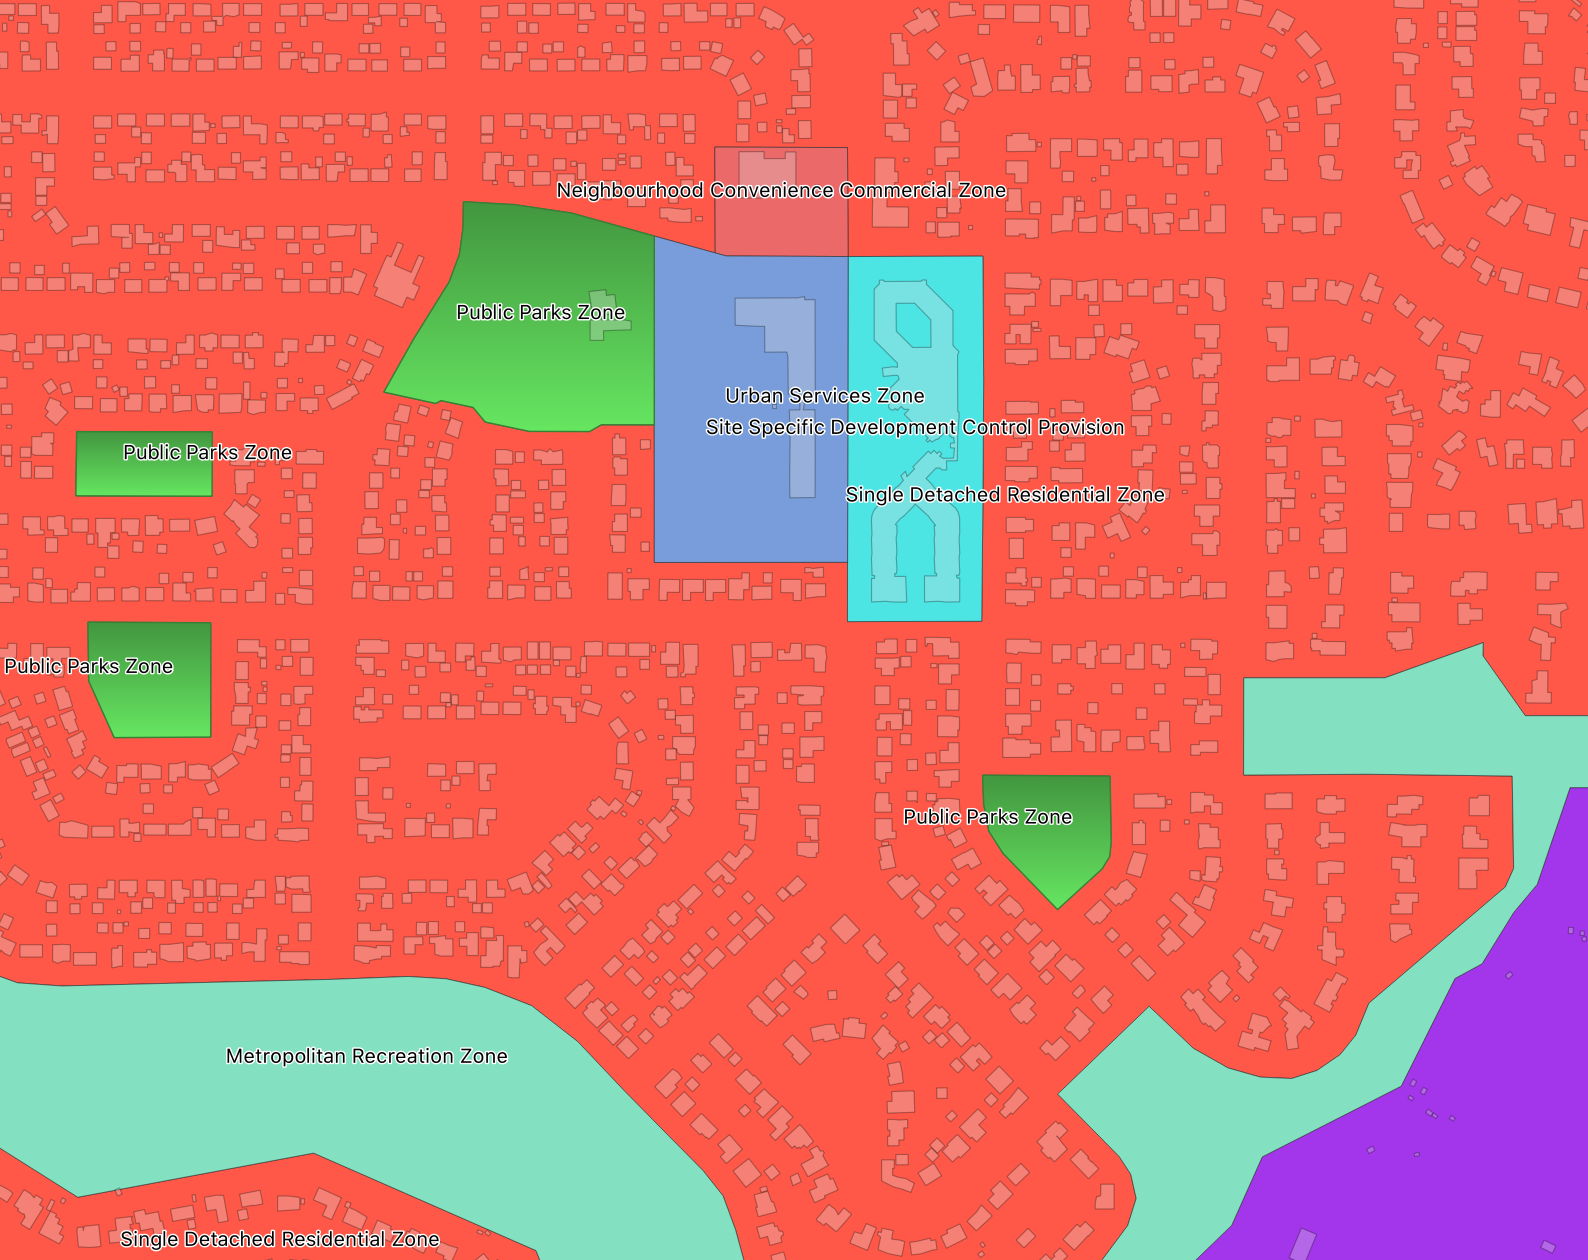
Zoning in the Laurier Heights and surrounding areas. The orange represents a ‘Single Detached Residential Zone’, the green represents ‘Public Parks Zone’, the darker blue represents an ‘Urban Services Zone’ (Laurier Heights School), and the light blue represents a ‘Site Specific Development Control Provision’ (The Canterbury Court retirement community). The ‘Metropolitan Recreation Zone’ is a wide ranging zone used though much of the river valley; the section shown in the image above also has the section of the Whitemud north of the Quesnell Bridge. The purple zone contains the Valley Zoo, and is called a ‘River Valley Activity Node.’
Created in QGIS using zoning data, neighbourhood and roof line polygons from data.edmonton.ca.
Simple, right?
Not so much.
In taking a critical view of zoning, it’s possible to ask some questions that shed a light on who zoning serves, who the decision makers are, and who benefits as zoning carries with it deep seated inequity. What do I mean by inequity? If zoning simply defines what types of buildings can be built where, how does that create inequity?
In a general sense, the act of deciding what can be build where will invariably include some folks in the most desirable locations, and exclude other people from those same locations. For example, a casual examination seems to indicate that the most dominant zone adjacent to Edmonton’s river valley is the ‘Single Detached Residential Zone’. It makes sense, right? Build single family houses close to amenities like the river valley. Only, this would be inequitable if only wealthy people can afford to live in the houses built in neighbourhoods adjacent to the river valley.
The same is true for access to other services like other green space, supermarkets, hospitals, etc. On the flip side, we can ask who lives next to our busiest roadways? Who lives closest to the refineries on the east end of Edmonton? Who has access to quality transit? Who lives in food deserts?
I hope to look at these questions in the coming weeks using the data found in the City of Edmonton’s open data portal. I will explicitly link to the data and tools I use, and analysis I conduct.
Caveat time: I am not an expert in zoning and land use planning. I am a white CIS male heterosexual and am one of the people who benefits from zoning. That said, I hope to bring something to the zoning discussion by looking at zoning through a lens of equity and white supremacy, and am happy to have my work reviewed and critiqued.
This blogging project is intended as a way for me learn about and explore zoning in Edmonton, to pull in examples from other jurisdictions, and act as a tool to document and explain my learning.
Please let me know what you think.
Data Sources:
The Zoning Map Data is on data.edmonton.ca and can be found here.
The Zoning Bylaw can be found here.
I use a free and open Geographic Information System called QGIS. It is available for Mac, Windows and Linux operating systems and can be found here. If you are interested in GIS, this is a great place to start as QGIS is easy to download and install on your computer, and the project supports a ton of instructional material through the website, and on other channels such as YouTube and StackOverflow.
Edmonton's Residential Development Permit Process is Broken
The City of Edmonton's residential development application process is broken. I had a horrible experience that could have been much easier, less time consuming and a lot less costly. Here is my story, the issues that I have with the process and some thoughts on how to improve the process.
The project
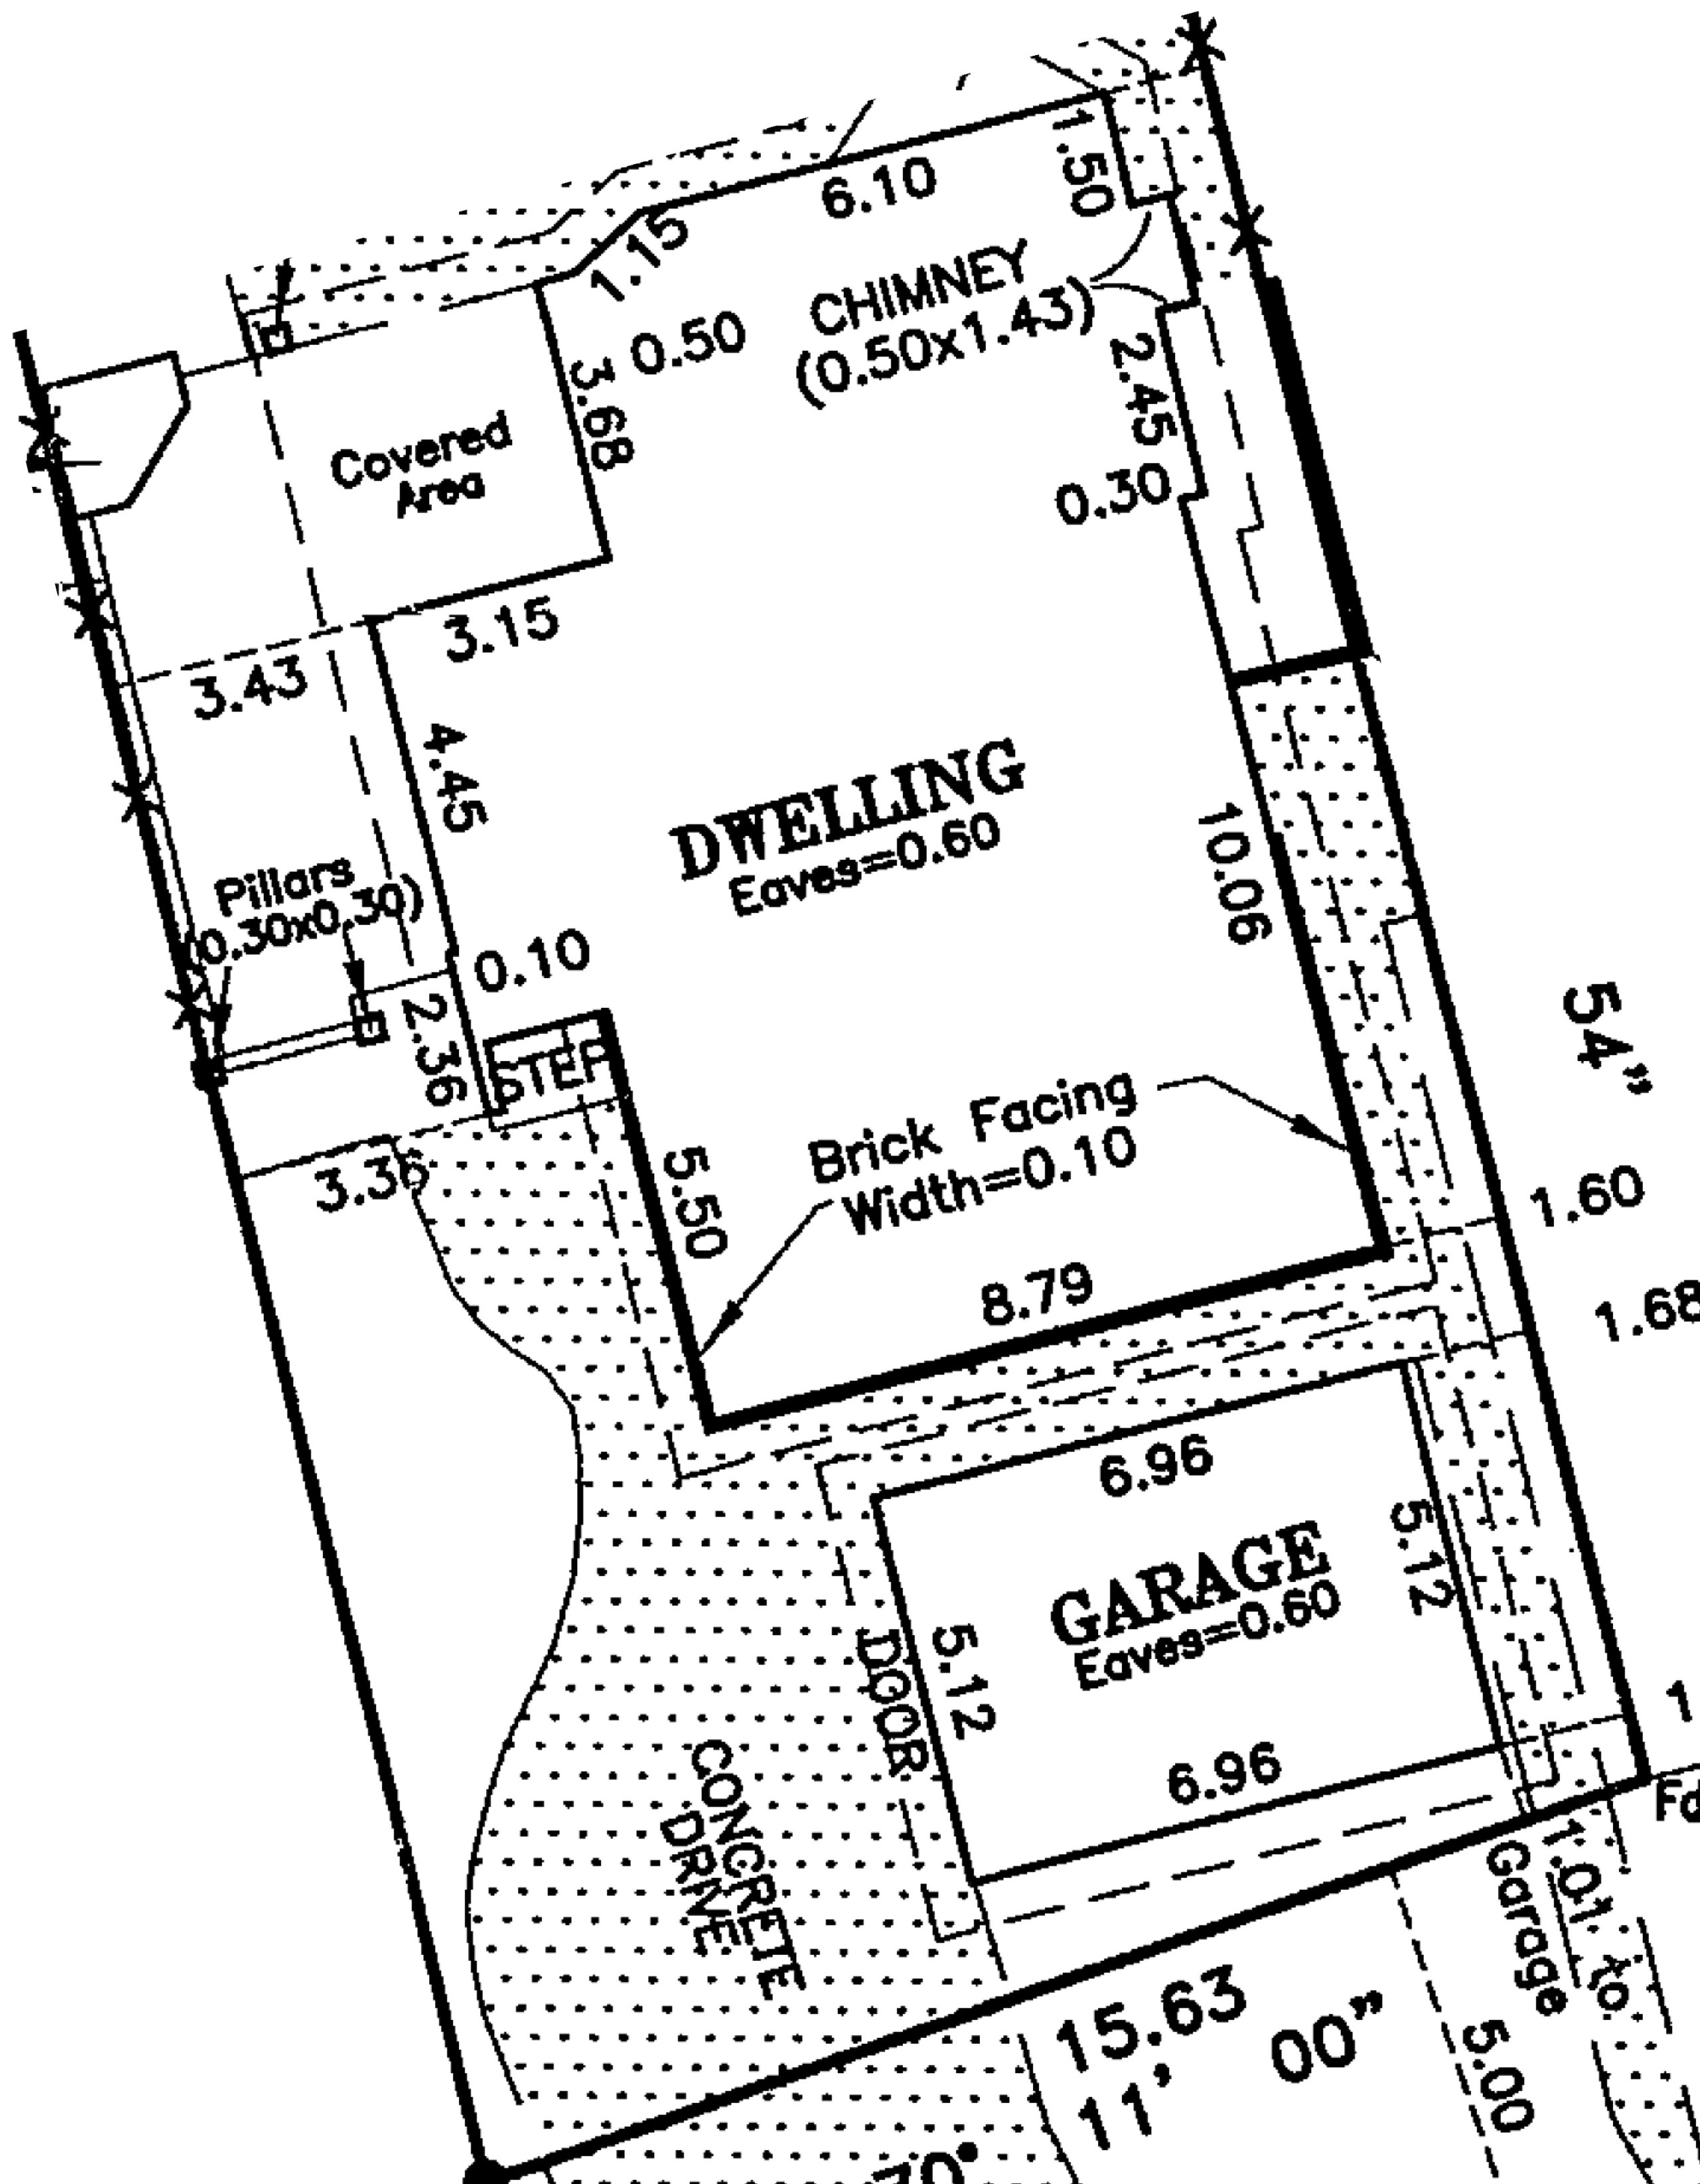
Our project was to add 10 square meters to the north portion of the garage, and in the process fill the 1.51m gap between the house and the garage. A window on the south side of the house would have to be moved, as well as a so called 'man door' on the north side of the garage. It's a relatively simple project, and I thought an easy ask of the City. Because I have a background in geography (and could not find someone to do the drawings), and have done many to-scale drawings in the past, I decided to do the following myself, which I put together in a 13 page PDF:
- A rationale and justification for the project
- A site plan (from the RPR)
- A floor plan
- A south and west elevation
The PDF also included 12 photographs of the houses on the blocks to the east and west documenting that an attached garage was normal for this neighbourhood. I also addressed the concerns raised in the City of Edmonton's Mature Neighbourhood Overlay. Specifically:
- A variance was identified in that the garage was within 3m of the property line (the variance already exists, and we would not change it by building on the north side of the garage);
- The total footprint of the property was 2% over the allowed ratio (to address this, we offered to remove a small shed in the back that is considered part of the calculation);
The process
I met with a City of Edmonton Applications Officer. We had a nice discussion, and he offered some advice that would help with my application, and assured me that all of the elements needed were present and adequate. I left, modified some of the documentation, and emailed hime the PDF on 21 March. The I waited. I emailed 3 times over the next three days to ensure that the applications officer got my file. He did. I emailed several more times, and called regarding the progress of my application - I even went so far as to call 311 to get the development officer's name and phone number. I called several times to no avail.
I did not hear back until 03 May, when I received an email that stated:
I have received your application back from the development officer They can not make a decision on what has been provided. They would require scaled drawings of the house, floor plans, elevation drawings and a site plan showing setbacks from the property lines.
When I discussed the outcome with the applications officer I asked if I could phone the development officer. I just wanted to talk with a decision maker to explain what I wanted to do. I was told that '...it was not a good idea...' the development officer in question was not approachable. I felt like my application was being judged by criteria not mentioned anywhere (i.e. that my drawings were not done by a professional), and that there was not one person with whom I could talk to about it.
Needless to say, I was disappointed for a couple reasons - (1) I was misled into thinking that my application was adequate when it was not, (2) I was not able to talk with the decision maker - I planned on re-applying and wanted to understand the requirements, and (3) I felt like this was a closed and adversarial process.
Over the next weeks I was able to find a person to make the drawings, and was able to reapply with professional, stamped drawings and a block face plan for my street. I was turned down again, so I immediately appealed and took my development application to the development appeals board.
The appeal
This was an interesting process for a few reasons:
- The Development Appeal Board is independent from the City of Edmonton, with board members being appointed from the public.
- Their process and requirements are well documented and were discussed with me at great length by a planner who works with the appeals board.
- They provided a checklist of requirements, a timeline with the expected date of the hearing, and an phone number to call if I had any questions! This is in stark contrast to my previous experience.
- They provided a deadline for presentation materials, and what they should consist of.
- They also suggested that I talk to my neighbors within 60m of the property to see if they had any issues. I did, and my neighbors had no issues.
In fact, 2/3 of my neighbors have had a similar experience with the city's development process, and signed my sheet on principle. They pitied my this 'ridiculous' process and it worked to my benefit.
I presented to the appeals board, answered a few questions and waited for the answer. For the first time in since my first discussion with an application officer 7 month prior, I felt like I was talking to the right person, like I was being heard and that I would be given a reasonable answer. 20 minutes after my presentation I was told that I would receive a development permit in the mail.
Recommendations and conclusions
In reflecting on the process, some weeks after we received the development approval, I think the most pertinent issues relate to transparency of process, including communication, and providing process support. My recommendations:
- The City of Edmonton should have a step-by-step guide to residential development applications, from where to get drawings done, to all of the official and unofficial criteria for an application. This process should be open to all home owners, just those who hire professionals to do the drawings and project manage the process. A citizen with a scaled and clear drawing on graph paper should be treated as equally as those with professional drawings and a contractor well versed in the process.
- Assign a main contact within the development application department who can address any questions related to an application.
- Allow the applicant to talk to the decision maker.
- In this role, the City is providing a service while enforcing / upholding a set of by-laws. The application and development officers should have adequate communication and collaboration training. The application process SHOULD NOT be adversarial.
yegdt: Land use in downtown Edmonton - preliminary analysis
Edmonton's downtown is a growing and changing entity. In recent memory Edmonton's core has gone from being mostly dead, to having a few sections of vibrant life with interesting restaurants, bars and a wide range of events. On an infrastructure level, the core is shifting away from surface lots and empty buildings to new developments including high rise buildings such as the Epcor Tower and the Icons on 104th (thanks in part to the muni being shut down). This gives rise to the question of how downtown land is being used. So I, of course, made a map.

The area of this map is defined by the City of Edmonton's Downtown Neighbourhood Boundary. The black polygons on this map represent surface parking lots (~15% of the downtown area). The surface lots, in conjunction with roadways (~12% of downtown area), represent about 27% of the surface area of downtown core. Buildings occupy 25% and parks space 6%. I was astonished to learn that there are over 2800 trees in the downtown, with over 25 species (tree data from data.edmonton.ca). I captured each one. Rather than document each tree in a huge legend, I created a teaser that allows you to mouse over each point to discover the trees in your neighbourhood.
Some things of note about the map - a full 27% of the downtown core is devoted to cars, and this data does not include parking garages or underground parking. There is more square feet of land dedicated to vehicles than to building footprints, and only 6% to park space. Wow.
There are two main sources of data for this project. One is from an article about parking in Downtown Edmonton published on Spacing Edmonton. Kyle Witiw, the author, was kind enough to share his hand-drawn parking data with me. I then downloaded the Edmonton OpenStreetMap data from an OSM metro extracts site, and teased out the various buildings in the core, compared and corrected the OSM parking data with Kyle's data, and mapped it using QGIS + TileMill and MapBox. Kyle pointed out a couple of problems with my data, including:
The surface parking that used to exist on the NW corner of 104 street and 102 ave no longer exists - the Fox One condo development is currently going up on that site.
I have not yet corrected that.
There are some additional issues with these data. The road data is likely an under estimate as I measured the length of the roads bounded by the neighbourhood boundary, and then multiplied each length by the number of lanes (2) and width per lane (3m) to get the total area. I did not account for parking lanes or turning lanes, as such I think that I have under estimated to total surface area of roadways. Also, several park spaces are not in the data sets - for instance the area west of Canterra Centre at Jasper and 109 is poorly documented and does not include the park that contains the walking/biking trail. Also with Canterra, Save-On-Foods is missing, as are the condos to the westThe addition of these residential and commercial footprints would slightly increase the overall built-up area in the core.
In addition, the blue buildings have been classified as a 'mixed use'. The OpenStreetMap data (the basis for the building and park data) does not define the use of the blue buildings. I plan on updating the OSM data so that I can, in the future, produce a better map (I will also update the OSM data with Kyle's suggestion above).In summary, the data needs work and the best place to make data improvements is in the OSM database.
Please feel free to let me know what you think.
Air Quality Egg: It's all about the data. Part One
For many reasons the Air Quality Egg represents a profound shift from the current regiem of regulator controlled Air Quality monitoring Specifically, the current model of AQ monitoring sees a regulator (government) define the AQ issue, the substances of concern, and the monitoring response to these top-down defined concerns. The AQEgg turns this model on its head by allowing, though citizen lead (though still early adopter) monitoring technology that is accessible to those who can afford a $185 sensor, or have the knowhow to build their own via 3D printers and electronic schematics. In other words, the model shift from top down to bottom up where a citizen, or group of citizens, can define where monitoring should occur. As detailed in this post, the current AQ monitoring network focuses on a regional level of air quality. For instance, there are three sensors in Edmonton that provide a regional overview of the air quality through a metric called the Air Quality Health Indicator. Southern and Western Ontario have a total of 15 stations (see map below) that provide air quality data for over 6 million people.

The AQ Egg provides three distinct advantages:
- They can be located at street level more easily. We really have no idea what is happening on street level and that the numbers may be well above what the regional AQ network reports.;
- The map provided my COSOM is more interactive and open. In fact, developers have already started developing products in support of the AQEgg. See the Air Quality Egg Helper Chrome extension;
- The AQ Egg data are open and available for download and analysis. This open data philosophy is not consistent across all regulators.
The one big advantage of regulator monitoring is the quality of the sensor, and thus the data where the measure of a sensor is the quality of the data it provides. As stated on the AQEgg wiki "...more work is really needed to make the low cost sensors sensitive to ambient pollutant concentrations." This can be seen in the sensitivity of the NO2 sensor as compared to actual ambient concentrations. In Vancouver, for instance (from the 2011 Lower Fraser Valley Air Quality Monitoring Report [PDF], pp. S-9) the annual average NO2 goal for Vancouver is 40 ug/m3 or less, with the one hour range being up to 122 ug/m3. The range of the NO2 sensor is 94 - 9400 ug/m3, less sensitive than the 'normal' ambient concentrations as detected by the regulator sensor.
Furthermore, the quality of the data is confounded by cold (an issue where I am from in Edmonton), and humidity. Regulator sensors heat or cool the air feed to a standard temperature and strip out any humidity to create a 'clean' sample.
My next post, hopefully coming soon, will examine some of the initial data generated by the AQEggs as compared to the regulator data.
Why I don't support mandatory helment laws.
Please skip to 4.0 Conclusion for the abridged version of this long post. 1.0 Introduction I wear a helmet when I bike, and cannot imagine cycling without one when either road riding, mountain biking or on a family ride. I am uncomfortable without a helmet and feel vulnerable to injury by cars and my own stupidity - I have fallen off my bike often enough to know that for me a helmet is probably a good idea. Furthermore, I am trying to instill this habit with my children; they always have a helmet on when they get onto any self propelled wheeled vehicle. To my mind, there is no downside to wearing a helmet as long as you cycle within your ability.
But, having said the above, I am not certain that mandatory helmet laws are effective in preventing head injuries. In fact, I wonder if the bicycle helmet debate distracts us from a harder discussion on road safety and risk. I think that it is easy to have a public debate about a fringe group of cyclists and how they should be safer, rather than focus on road safety which would include slower residential speed limits, impact road and urban design, and be more difficult to reach consensus. After all bike helmets save lives, right? I am not sure, and so I am looking to answer the following questions:
A. Do mandatory helmet laws prevent head injuries?
B. What are the consequences, intended or otherwise, of mandatory helmet laws?
C. Are there better ways to protect cyclists?
I am writing within context of Alberta, which has had a helmet law since May 2002 that applies to children under the age of 18. Furthermore, this is a first attempt at understanding a complex issue. Please help me understand you position, comment below!
Please note: I AM NOT ADVOCATING A BEHAVIOUR. I WEAR A HELMET, AND SO DO MY KIDS. YOU CHOOSE WHAT IS BEST FOR YOU!
2.0 Evidence Based Policy I don’t think that it is correct to assume that helmets save lives, just as I don’t believe that climate change is a hoax because it is −20C in Edmonton while I write this. Where there is a hypotheses related to policy, there should be a way of collecting data to test that hypotheses. In other words, good public policy is not made from individual cases, anecdote, or from a gut feeling, but rather should be made from a position of informed choice where all viable options and outcomes are examined through the lens of data analysis. The final policy choices may be made for political reasons, but at least these are informed decisions. Medicine is an example where evidence plays a big role in determining best practices. As discussed here, evidence based medicine (EBM) is the “…conscientious, explicit and judicious use of current best evidence in making decisions…”.
Every time (I hope, but perhaps this is a pipe dream) you go to an emergency department, see a medical specialist, or have a procedure done, you rely on this process to get the best results and safest treatment (otherwise you see a naturopath). Evidence based decision processes do not have to be limited to medicine, we can expect the same rigor for public policy, in general, and within the helmet debate specifically. To that end, I plan on examining the evidence that addresses my questions.
3.0 What does the data say? Three types of data should be considered when assessing whether cyclists, by law, should be required to wear helmets - (1) bicycle / vehicle collisions and (1a) bicycle incidents that are comprised of falls or collisions with stationary objects or other bikes, and (3) emergency room visits related to bicycling accidents. These data should be looked at within an Albertan and international perspective. To give a relative risk, pedestrian data will also be examined. Caveat: I don’t have total numbers of cyclists and pedestrians - so their is some interpretation going on here based on totals numbers.
3.1 Bike, pedestrian and vehicle interaction in Alberta The following data are taken from Alberta Traffic Collision Statistics 2010 (found here [PDF]) , and represent the number of incidents for 2010.
| Road User | Killed (N) | Killed (%) | Injured (N) | Injured (%) | Total (N) | Total (%) |
| Drivers | 185 | 53.8 | 11012 | 60.3 | 11197 | 60.2 |
| Passangers | 65 | 18.9 | 4528 | 24.8 | 4593 | 24.7 |
| Pedestrians | 35 | 10.2 | 1129 | 6.2 | 1164 | 6.3 |
| Motorcyclists | 31 | 9.0 | 683 | 3.7 | 714 | 3.8 |
| Bicyclists | 6 | 1.7 | 467 | 2.5 | 467 | 2.5 |
| Other | 22 | 6.4 | 450 | 2.4 | 462 | 2.5 |
| Total | 344 | 100 | 18253 | 100 | 18597 | 100 |
These data were copied from Table 3.1 of the Alberta Traffic Collision Statistics, 2010
3.1.1 Observations I am surprised that more pedestrians were killed and injured than bicyclists in 2010. 1164 pedestrians (6.3% of the total) as compared to 467 bicyclists (or 2.5% of the total). These are interesting numbers, but not really relevant unless we know the total number of pedestrians in Alberta vs. bicyclists. Or even better, the total number of kilometers walked by pedestrians vs. the total number of kilometers cycled by bicyclist. In this latter case, we could then calculate injuries and deaths per kilometer travelled for each case. It would also be interesting to factor motorcycles into this mix. A side note. The raw numbers clearly indicate that about 2.5 times more pedestrians were killed than cyclists in 2010 and yet no one is suggesting that pedestrians wear helmets.
3.1.2 Other observations from the Traffic Collision 2010 report From the same report, Table 9.4 indicates that “Casualty rates per 10 000 population were highest for persons between the ages of 15 and 19”. The lowest rates were for those under 5 and over 55. 27.1% of bike accidents due to the cyclist disobeying a traffic signal, and 13.5% due to the cyclist failing to yield the right of way at an uncontrolled intersection.
From Table 9.3, 9.2 and 9.1 - most accidents occurred on weekdays between 3 − 7PM (rush hour), in June. From Section 8 of the report; Pedestrians faced the similar hazards, with most vehicle, pedestrian interactions occurring during rush hour, in October. It is interesting to note the language of the report points to the actions of the drivers being responsible for pedestrian injury (rather than pedestrians being responsible for their own injury) or death, versus the action of the bicyclist being responsible for their own injury or death.
3.2 Cycling rates and ER admittance The section will draw upon a PhD thesis, from the University of Alberta, written by Mohammad Karhaneh in 2011. Commentary and insight on this thesis was found here. . Karhaneh notes the following based on pre- and post-law observational studies completed in 2006:
- There was a large decrease, 56%, in children’s cycling from 2000 to 2006.
- There was also a decrease in teenage (13-17YO) cycling at 27%
- A 21% increase in cycling for adults.
In his dissertation, Karhaneh simply notes a decease in the number of people seen in the ER as a result of cycling injury. He does not create a ratio of cycling injury to the number or rate of cycling in the population (from cyclehelmets.org). In contrast to the decline in cycling, the rate of injury seems to have gone up after a mandatory helmet law was legislated. As cyclinghelmets.org notes:
“The number of children treated in emergency rooms for non-head injuries was an average of 1,762 per year in 2003-6 compared with 1,676 in 1999-2002, despite there having been a fall of 56% in children cycling over the period. For teenagers the average number of injuries rose from 870 to 1,101 per year while the amount of cycling went down by 27%.”
4.0 Conclusion
This is a complex issue that involves many factors, and I have only offered a slice of the available data, with some commentary that makes sense to me provided by cyclehelmets.org. I have not touched on most of the available data, nor have I explored the physical limits of helmets as protective equipment (see here [PDF] for an overview). I have also neglected to look at injury rates in other jurisdictions that have slower residential speed limits, dedicated cycling lanes and a stronger bike culture. I could complete a PhD on this question, and in fact some have - perhaps this complexity and depth of information is a barrier.
To summarize, it seems that helmets are of use for a limited population in certain circumstances, as in children cycling at slower speeds who fall a shorter distance onto smooth ground. As soon as the speeds increase, and the falls become more complex (uneven ground, impacts with other moving objects such as cars, etc.), the protective benefits of a helmet are negated. Male children 15 - 19 seem to be the most at risk of injury - the data indicates that they are, as a population, more reckless, and take greater risks beyond the capacity of a helmet to manage. In fact, it is speculated, that if they were not wearing a helmet, that 15-19 YO males might not take so many risks. In other words, the helmet was perceived to offer more protection than it does. This finding can be extrapolated more widely to account for the general increase in head injury found in Alberta AFTER the introduction of bike helmet laws. People take more risks when they think they are protected + the limited protection afforded by a helment = more cycling injuries.
I also got the sense from the data that a culture of cycling was protective against injury for those who commute. Dedicated bike lanes, more bikes on the road and drivers who were more aware seems to make roadways safer. I also wonder about residential speed limits for overall road safety. What if we were limited to 30KM/HR rather than 50?
Finally, the data also seems to indicate that the perception of cycling as a dangerous activity dissuades people from riding, leading to two unfortunate outcomes: (1) those who do not cycle, don't gain the health benefits, and this could be significant given increases in obesity, and; (2) spontaneous Bixi Bike type trips are less likely to happen in those jurisdictions that have helmet laws.
“In general the rate of head injuries is declining, but this is not consistent across the country, nor is it attributable to legislation as some provinces with legislation experienced a decline while others did not.” Middaugh-Bonney T, Pike I, Brussoni M, Piedt S, Macpherson A, 2010. Bicycle-related head injury rate in Canada over the past 10 years. Injury Prevention 2010;16:A228.
images of our city: ezio farone park
 Everyone knows Ezio Farone Park. Its the park at the top of the stairs adjacent to the Glenora Club, and is a node between the southside and downtown; the top of the bank with the river valley. I lived for years at 100 Avenue and 110 Street and love how cycling and pedestrian traffic flows north / south through Ezio. On winter days while walking down to the Kinsmen, I could feel the temperature drop as I descended down the stairs into the River Valley.
Ezio Farone park is named after Constable Ezio Farone, a member of the Edmonton Police Service who was killed in action on June 25th, 1990 (from Crime and Punishment website here). While the park is lauded by the running and stair walking community, it is more than just a stairway to fitness heaven. Ezio Farone is a hub of transportation and offer some of the best views of the River Valley, the University and the High Level Bridge. Just check out a Flickr Search to see the great views offered by the park. Furthermore, Ezio provides the best vantage point for the Canada Dat fireworks, as is evident from Flickr.
But, more importantly, Ezio's place in Edmonton is based on several design choices that I think work in the park's favour. The park flows north to access points at (1) 110 street, (2) to the bike trail that parallels 109 street, and; (3) pedestrians can walk up 111 street.

The central part of the park has a few paved trails that connect with the High Level Bridge, stairs adjacent to the Glenora Club, and paved paths that run to the west adjacent to the Victoria Golf Course. It is a true urban park offering great access and is used by people seeking exercise (boot camps, stair running), strolling or simply sitting around. Walking up 100 street offeres access to one of the heritage communities in Edmonton, and to the Grandon LRT station.
Up on the right near the Copper Pot restaurant stands a parkaide next to a hight rise building. A section of the parkaide is distinguished because it is constructed out of clinker brink, by Peter and Olga Figol. Clinker brick is baked at a very high temperature rendering the bricks denser and less pores that normal bricks, they also represent an 'Arts & Crafts' style. Clinker bricks are not used as building materials, and are rarely seen in Edmonton.


The escalators from track level to the Grandin Station feel deep and steep, and when you emerge from the tunnel on a summers day, you are met by tall mature trees and an urban environment that is saturated with green space . This community, part of Oliver, flows well from the River Valley, through Ezio Farone and connects with Jasper Ave a few blocks to the north. Groceries, local and chain coffee shops and cloths shopping are all accessible within a short walk. While each of these elements on its own is not remarkable, in combination they allow this community to shine.
Urban GeoWeb 2
Health applications and data are becoming a greater part of the GeoWeb as more people start working with aggregated data sets to look for trends. of course, MIT is exerting some influence in this domain with their Health Infoscape project. From the project website:
Health InfoScape from MIT Senseable Cities and GE aims to create new ways of understanding human health in the United States. By analyzing data from over 7.2 million anonymized electronic medical records, taken from across the country, we are seeking to uncover statical relationships between space, geography and health.We often have a tendency to think of illness as an isolated event, but our first analysis details the numerous (sometimes unexpected) associations that exist around any given condition. This gives us new insight as to how closely connected some seemingly un-related health conditions might be. Such results force us to re-examine conventional categories of disease classification, as the boundaries between traditional disease categories are thoroughly blurred.
Another big player in the GeoWeb domain is UCLA, with their URBANSENSING project, their vision:
We see a future in which we - individuals, neighbors, friends, and relatives - can use the technology around us to observe, discover, and act on the patterns that shape our lives. Whether your passion is personal or global, whether your interest is in health or the environment, whether you act alone or in a group, Urban Sensing is a new approach that empowers all of us to illuminate and change the world around us.
Within this context, there are two project that I think are particularly excellent: (1) Personalized Estimates of Environmental Exposure and Impact (PEIR), and; (2) Cycle Sense. PEIR seeks to document your environmental exposure within four categories - smog and fast food exposure, carbon impact and your impact on sensitive sites such as schools. This is accomplished through the use of location-based tech installed on your mobile devise.
Cycle Sense provide cyclists with current feedback on the quality and safety of the bike routes, and suggest modifications based on the time of day. This is accomplished within a larger community of cyclists who provide feedback by loggin their bike routes, and by providing geotagged annotations augmented by automatic sensor data common to many smart phones (sound, accelerometer) that can infer road roughness and traffic density.
images of our city: legislative grounds
 One of Edmonton's most used areas, and one of my favorite spaces, is the legislative grounds. The ledge is iconic in Edmonton with its domed roof and spire raised over the downtown, and is visible from across the river to the south, down 108th Street and from the east as well. The Legislature Building is situated on 23 HA of parkland that represents a history going back to the late 1800's when these grounds were a 5-hole golf course. A history of the Legislative Grounds can be found here (PDF).
What I like about the ledge is its status in Alberta, as the seat of government, and its use by the citizens of Edmonton and Alberta. The grounds represent the diversity of people that can be found within Alberta, with symbols ranging from aboriginal (a totem pole) to Asian (Korean and Japanese symbols), including several memorials to workers and the Holocaust.

The ledge grounds are welcoming and used. In the summer it is common to see children splashing in the pools to the north of the legislative building, as well as office workers sitting in the sun during lunch and coffee breaks. The grounds also link the north side of the High Level Bridge with downtown, allowing pedestrians and cyclists a traffic-free alternative to their commute. Canada day is celebrated with cycling races, Christmas with lights; Hanukah and other multi-cultural events are also celebrated. Protesters also march to the steps of the legislative building to voice their concerns and disapproval.


These events are significant in that they provide the context for the grounds as being public, open, and inclusive - even democratic. In a time when 'space' is more often private or a weird hybrid of public and private (for instance, Chapters, where you are welcome if you are willing to pretend that you have and want to spend money). These grounds welcome everyone, and people are empowered to experience and interact with others and the space adjacent to our elected government.
One of my biggest concerns with the legislative grounds is currently being addressed. Given the current slate of demolitions in Edmonton, it is encouraging the see that the Federal Building is being refurbished. The renovation began in 2008, and will be completed in 2011 in time for Alberta's 100th anniversary in 2012. The design concept of the renovation includes a west entrance pavilion re-orienting the building towards the legislative grounds and adding to the public space found on the grounds, there will be an additional 650 underground parking stalls added, and a skating rink.

I believe that the legislative grounds provides an interesting and public connection between the riverside and the downtown core. While the extent of the grounds, size and nature of the buildings makes this close to impossible to replicate in other parts of Edmonton, there are design elements worth considering. The linkages between different modes or transportation (transit with a terminal on the east side of the grounds, walking, cycling, parking), activities such as splash ponds, and skating, coupled with public space make this a model to be replicated.
Towards Data Driven Urbanism
We’re a city of nearly 800,000 people, and we’re basing the public involvement part of the decision on 80 comment forms and 15 interviews? I truly believe more people want to provide feedback, it’s just too difficult to do so at the moment. Mack Male, in a blog on Public Involvement.
A recent blog post in the Charette.ca discussed the idea of DYI Revitalisation, where a bunch of citizens, business owners and associations get together to host evens such as the 104 Street Block Party. There are several benefits that arise from closing down a few blocks of a downtown street that include building a sense of community, connecting citizens with the local business, artests, musicians, each other. While the 104 Street Block Party is an awesome event that highlights what a place can be, it is a shallow way to engage citizens in a meaningful discussion of urban planning and development. In my view there are four practical "levels" that citizens can be engaged on: (1) a Charette where citizens attend municipally sponsored meets that address specific issues such as the Walter Dale Bridge Project, or the Arena; (2) DYI Revitalisation such as the 104 Street Block Party; (3) Tactical Urbanism, and ;(4) Data Driven Urbanism. We need all four to successfully engage citizens and municipalities, but we are currently operating at the first and second levels.
Tactical Urbanism (TU) is much like open source software development which seeks to produce consistent but incremental change over time. This requires frequent releases involving input from all who are interested in specific local projects. TU is implemented in an urban environment through experimentation (i.e. a single $500 bench rather than $10000 worth of benches) that supports (requires) feedback from citizens. Citizens are also empowered to claim their own space with paint and small infrastructure improvements (putting in a local bike lane, speed bump). The goal is to get people involved with the local through "a deliberate and sometimes experimental phased approach to instigating change. The result is the development of desirable locations and social capital between citizens, local government and businesses."
Data Driven Urbanism (DU) recognizes that the world of citizen engagement is changing with mobile devises proliferating our urban fabric even as the GeoWeb develops as a platform that enables crowdsourced mapping. DU recognizes that truly participatory planning must go beyond drawing on flip charts and maps and requires a plethora of open data sets, a platform of engagement and building long term relationships with developers and engaged citizens. What would it look like if we could GeoTweet a downed tree in a river valley path such that the River Valley Rangers received it; that these tweets were mapped? Now imagine if we could use the tools in our pockets - iPhones, BlackBerries and all other GPS, camera and connected mobile devises to provide feedback to our Municipality on what works and what does not. While there are privacy and behaviour concerns, these concerns are navigable and can be addressed.
The gap, as I see it, is a City wide strategy to address public involvement using new technologies and approaches. As great as the IT department is (and they are great!), they are too few to enact widespread change within the City of Edmonton bureaucracy. Immediate improvements that could be made tomorrow include higher standards for developers. For instance, why are they not required to produce 3D files for Google Earth that would allow citizens to engage with a developers vision? Why are public consultations limited to old style Charette, surveys and questionnaires? It is possible and desirable to engage with citizens via an on-line map that supports geo-located comments, wikis or discussion forums.
Within geography it is commonly understood that people are experts of their local environment. Lets engage with all who would have something to say about their locality via different and varied channels that include face-to-face meetings in addition to web-based consultations. The combined technologies of smart phones and the web as a consultation platform would offer a data driven approach to urbanism that might provide insight into what makes a location a place.