Getting People Off Their Chairs — Lessons from the Ecological Corridors & Crossings Forum
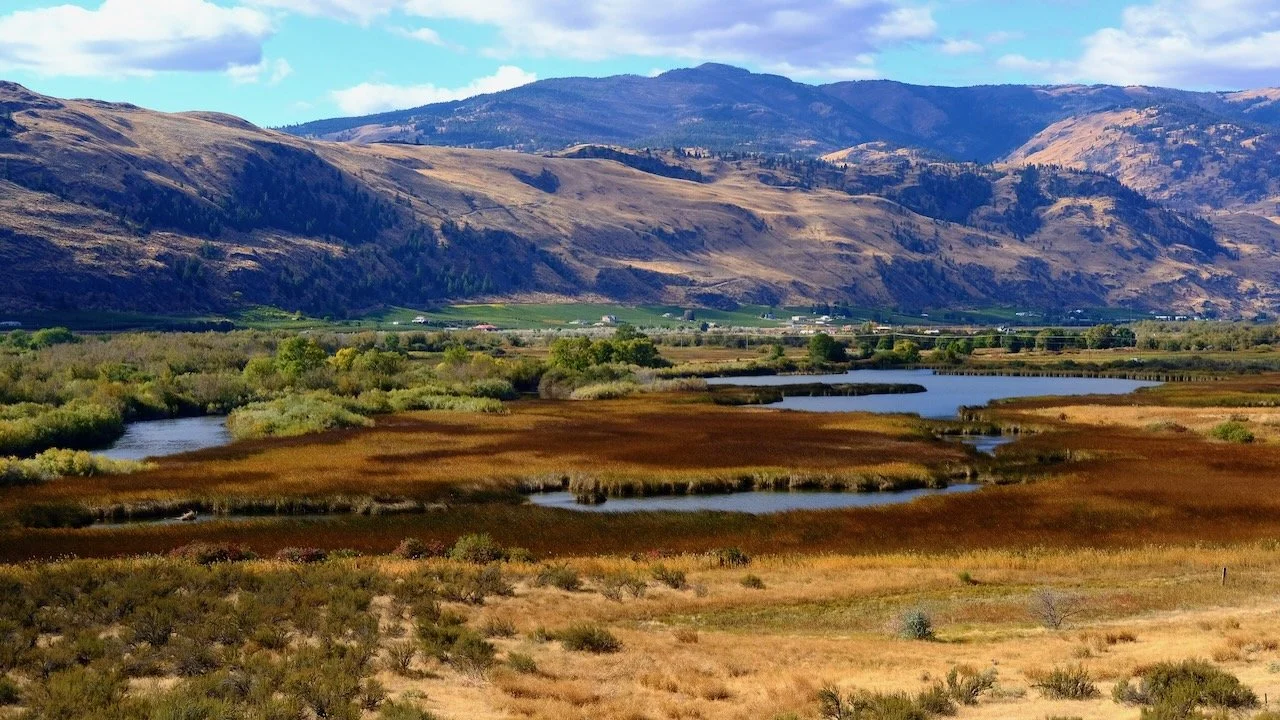
South Okanagan Wildlife Management Area, north of Osoyoos Lake.
The easiest thing to do when you're designing a three-day forum is to put people in a room and talk at them. Panels. Presentations. Q&A. It's familiar, it's low-risk, and it almost never produces anything worth the effort getting there.
For the Ecological Corridors and Crossings Forum in Kelowna last year, I wanted to try something different. The format was the thing I was most uncertain about.
We had fifty participants. First Nations representatives, government agencies, NGOs, academic researchers, community organisations. The people whose knowledge and relationships actually make corridors work in BC's Southern Interior. Getting that group in a room together was an achievement in an of itself. The question was what to do with them once they were there.
The Bus
We started the forum not in a conference room but on a bus. Half a day on the road, visiting two wildlife crossings and an ecological corridor, walking the land, listening to ecologists and Syilx Nation members talk about the ecology, the engineering, and the cultural significance of the work.
I'd worried the field component would feel like a detour. It wasn't. It was the foundation. By the time we sat down together the next day, people had shared something. A place, a perspective, a conversation on a bus that no agenda item could have manufactured. The room felt different because people had been somewhere together first.
Priya Parker writes about the power of a threshold, the moment of crossing from ordinary life into the gathering. The bus was our threshold, and it did it worked better than expected.
The closing.
On the final morning, I ran a modified version of 25/10 Crowd Sourcing, a Liberating Structure where participants rapidly generate and prioritise bold ideas. I was confident going in. The energy in the room by day three was exactly what you want it to be. People were relaxed, direct, genuinely glad to be doing the work together.
The results were good. Clear, actionable 24-month priorities that reflected the range of knowledge and interest in the room. That happens when the process has spent two and a half days building trust before you ask the group to produce anything.
What I'd do differently.
Priya Parker also talks about the facilitator as a benevolent dictator. Someone who protects participants by making clear, sometimes uncomfortable decisions about how the time gets used. I believe in this. I don't always practise it.
The Kelowna group was forthcoming and direct. We didn't lose much to vagueness or avoidance. But there was a brief stretch on day two, mid-morning, during the discussion of data sovereignty when I let the group conversation run a little long. The content was valuable, it set the mapping exercise up for success. It’s just that the conversation went a little long and I could feel the room start to drift. Phones came out. Two people stepped into the hall. Managing flow is a skill that hinges on who is in the room, and it’s a skill that I am always working on. Being the person who says that's a good place to stop, even when the conversation is good, is part of what it means to hold a room well. I didn't do it cleanly in Kelowna.
A note on format.
If you take nothing else from this post, take this. Get people off their chairs. Walk somewhere together. Visit the land the work is actually about. I've learned this in a number of different settings, from cycling with friends to driving with my kids. The conversations that happen in motion, on a bus, on a trail, at a crossing, are different from the conversations that happen in a room. Not better in every way. Different in the ways that matter most for building the kind of trust that produces real agreements.
The forum format is a tool, use it like one.
From Sakaw to Ceremony: How Edmonton Is Learning to Receive a Name
There's a neighbourhood in west Edmonton called Lewis Farms. Drive through it on any given morning and you'll pass the construction site on Rosenthal Way NW for what will eventually be one of the largest recreation centres in the city; twin arenas, a 50-metre pool, a library, a district park. It's a significant piece of civic infrastructure, built on land that sits at the western edge of the city, adjacent to Enoch Cree Nation territory.
The neighbourhood carrying the Lewis name doesn't raise many eyebrows. Ernie Lewis (1903 - 1987) was a farmer. The land was his and that's how naming worked for most of Edmonton's history. The name goes to whichever settler owned the land, or built the building, or sat on the right committee.
But that's not how the recreation centre will be named.
In a piece I wrote for Active History last year, I traced a particular pattern in Edmonton's naming history. In 1974, City Council named a neighbourhood in southeast Edmonton "Sakaw" — a Cree word meaning "wooded area." The rationale, as recorded in City Council minutes, was that the area had once been part of the Papaschase First Nation reserve before it was taken. Naming a small residential neighbourhood in Cree felt, to the committee, like a form of honour.
It wasn't. The land had been stolen as a consequence of actions taken by John Oliver. Nobody from Papaschase was consulted. The name was applied by settlers, to stolen land, as a way of feeling better about it. Eve Tuck and K. Wayne Yang call this a "settler move to innocence", a gesture that is a shallow mimic to reconciliation without requiring settlers to give anything up, least of all the land itself.
That pattern persisted in Edmonton naming for decades. Indigenous words appeared as street and neighbourhood names, assigned without consultation, sometimes without accurate translation, serving mostly to give places an ambient sense of Indigenous connection that cost nothing and changed nothing.
But something has shifted.
In June 2021, Edmonton City Council voted unanimously to remove Bishop Vital Grandin's name from the downtown LRT station. Grandin was an architect of the residential school system, a man whose explicit goal was the destruction of Indigenous language, culture, and family. His name had been on a station since 1989, accompanied by a celebratory mural. While Council voted to remove the name Grandin in 2021, the work to educate citizens on the role Grandin played in residential schools began years prior.
The harder part, and the more interesting part, was what came next. A renaming process was initiated, led not by the Naming Committee working through its usual channels, but by the Indigenous Relation Office working with Indigenous peoples themselves. The process was grounded in ceremony. Elders and Knowledge Keepers were the decision-makers. The name that emerged from that process has not yet been publicly released, because it belongs to that process — it will be released when the time is right.
That's a fundamentally different thing from Sakaw.
The same is true of the Lewis Farms recreation centre. The name for that facility has been gifted through a ceremony involving Elders from Enoch Cree Nation. It involved sweats, a Pipe Ceremony and formal protocol. Again, the name itself is not mine to share here — it belongs to the people who gave it, and it will be shared on their terms.
What I can say is this: in both cases, the dynamic has been inverted. The City is not naming. The City is receiving. That distinction matters more than any particular word on any particular sign.
I want to be careful not to oversell this. The shift from unilateral settler naming to ceremony-based, Indigenous-led gifting is real and significant. But it has happened through a series of individual processes, each process ad hoc, each dependent on the relationships and political will present at that moment.
There is still no policy mechanism that brings Knowledge Keepers and Elders into the naming framework itself. Edmonton has Memoranda of Understanding with the Confederacy of Treaty Six Nations and Otipemisiwak Métis Government, and those MOUs create relational obligations that the city is genuinely trying to honour. But when it comes to naming policy — the actual bylaws and procedures that govern how places get named — there is no formal, consistent pathway for Treaty Six Nations and other Indigenous Peoples to shape that policy alongside the City.
What we have instead are good processes and good relationships, project by project. That's better than nothing. It's considerably better than 1974. But it means the progress is fragile and dependent on the people in the room and the goodwill of any given council, rather than embedded in the policy architecture of the city itself.
Place names are infrastructure. They're repeated hundreds of times a day without thought, on bus routes, in conversation, in the mouths of children learning where they live. When those names are gifts, received through ceremony from the peoples whose territory this is, they carry a different kind of weight. They don't resolve the history. They don't give back what was taken. But they signal something true about who is being listened to, and how.
Edmonton is learning to receive a name. The next step is building the policy that makes that possible every time, not just when the circumstances are right.
Generous Authority: Stepping into Yourself to Hold the Room
The workshop was going fine until it wasn't.
I was facilitating an intensive one day session in Edmonton. The kind of work I'd done many times. There were about a dozen people in the room, and I knew them all to varying extents. I wasn't at my best, there was something heavier going on in my life at the time. I was functioning, I was just running on less than a full reserves.
The morning went well. We ran through the opening exercises and did a critical analysis and deconstruction of a large process map that represented the steering committee's workflow.
In other words, we attended to the practical elements of the agenda efficiently, openly and with some very good discussion. I had a clear understanding of the agenda, and what we wanted to achieve. And there was buy-in from the group.
It was in the afternoon that things started to go off the rails.
One of the participants started steering. There was a shift in the framework of the material that we were discussing. It moved from a practical reflection on material that was provided, to more of a conceptual idea of what our next steps were as a group and as a program.
He had a strong view about how the work should proceed, and he began advancing it. Not aggressively; persistently. A reframe here, a suggested path there.
I felt it happening. And instead of holding the process, I pivoted. Adjusted the agenda to accommodate his direction. I told myself I was being responsive to the group.
I wasn't. I was avoiding a confrontation I didn't have the energy for.
Once this participant had established his direction, the group followed his lead instead of mine. I became a servant to him, not the process.
The process didn't collapse dramatically; it deflated. Like air going slowly out of something. By the end of the day, we'd produced work that reflected his priorities, not the purpose I’d designed for. One moment of abdication, and the downstream consequences were noticable.
The question I keep coming back to: what would it have looked like to hold the room?
Authority isn't what you think it is
Facilitation has a complicated relationship with authority. I was trained to serve the group, to follow the energy, to hold space rather than take it up. That instinct is right, up to a point, the idea that stepping back is the same as making space. That the less we impose, the more the group owns the outcome.
Priya Parker, in The Art of Gathering, offers a term I keep returning to: generous authority. It describes a method by which a host can run a gathering with a strong, confident hand, but selflessly, in service of others. It informs my byline: leadership through service. That framing landed for me the first time I read it, because it described something I'd been circling for years without being able to say clearly.
Here's the part that matters and is evident to many; just because you declare authority does not mean that you hold authority. I opened this session with a clear purpose and a solid set of ground rules and I still lose the room by the early afternoon. I was not willing to enforce what I had established. That participant wasn't setting out to hijack anything. He was filling the space I had left open.
The process belongs to the group. The container belongs to you, the facilitator. Those are different things, and the second one is not optional.
The cost of false neutrality
There's a version of facilitation that focuses on neutrality. We are not domain experts, and therefore act as a neutral participant in the process. In effect, though, that is just avoidance dressed up as virtue. I have told myself that I’m holding space. Sometimes I’m not holding anything.
The truth is, we are domain experts. We are experts in process, in the outcomes defined by the group using a process we designed. A room with no one at the helm doesn't become more democratic. It becomes more susceptible to whoever is most comfortable taking up space, which is almost never the person with the quietest voice or the least positional power.
In governance contexts especially, where the power differentials are real and the stakes are high, being neutral isn't neutral at all. Abdicating process expertise advantages the people who know how to work a room.
What generous authority actually looks like
Four things, in practice.
Confidence to take up the space you’re paid to hold. I didn't show up at 100%, and that was reflected in my lack of confidence to serve the group and exert my expertise in the domain of process. In this instance, a bit of conflict would have benefitted the group.
Protecting the group. The courage to interrupt, to redirect, to name poor behaviour before it takes hold. Kindly, graciously, but firmly. It's not about being the authority in the room; it's about keeping the room safe enough for real work.
Equalizing the guests. In any group there's hierarchy, positional or otherwise. Cultural. Historical. Part of your job as a host is to actively design and enforce norms that keep those differentials from determining who gets heard. You can't pretend they don't exist; you can refuse to let them run the table.
Connecting the guests. The measure of a successful gathering isn't how many good ideas came from the facilitator. It's whether the connections between participants deepened. A gathering that starts with more host-to-guest connections than guest-to-guest connections, and ends with those tallied reversed, has done something real.
Back to the room
So what would generous authority have looked like in that workshop?
I would have interrupted him earlier, before the group had started to follow his lead. I would have named what was happening without making it about him. Something like: we've drifted from where we need to be, and I want to bring us back. Not dramatic. Not hostile. But it requires you to be willing to be the person who says it.
That's the thing facilitation culture doesn't say out loud enough: the willingness to be mildly disliked in service of the group. Generous authority isn't a destination. It's a practice, and some days it asks more of you than others.
Collaborative Mapping: When the Frame Matters More Than the Exercise
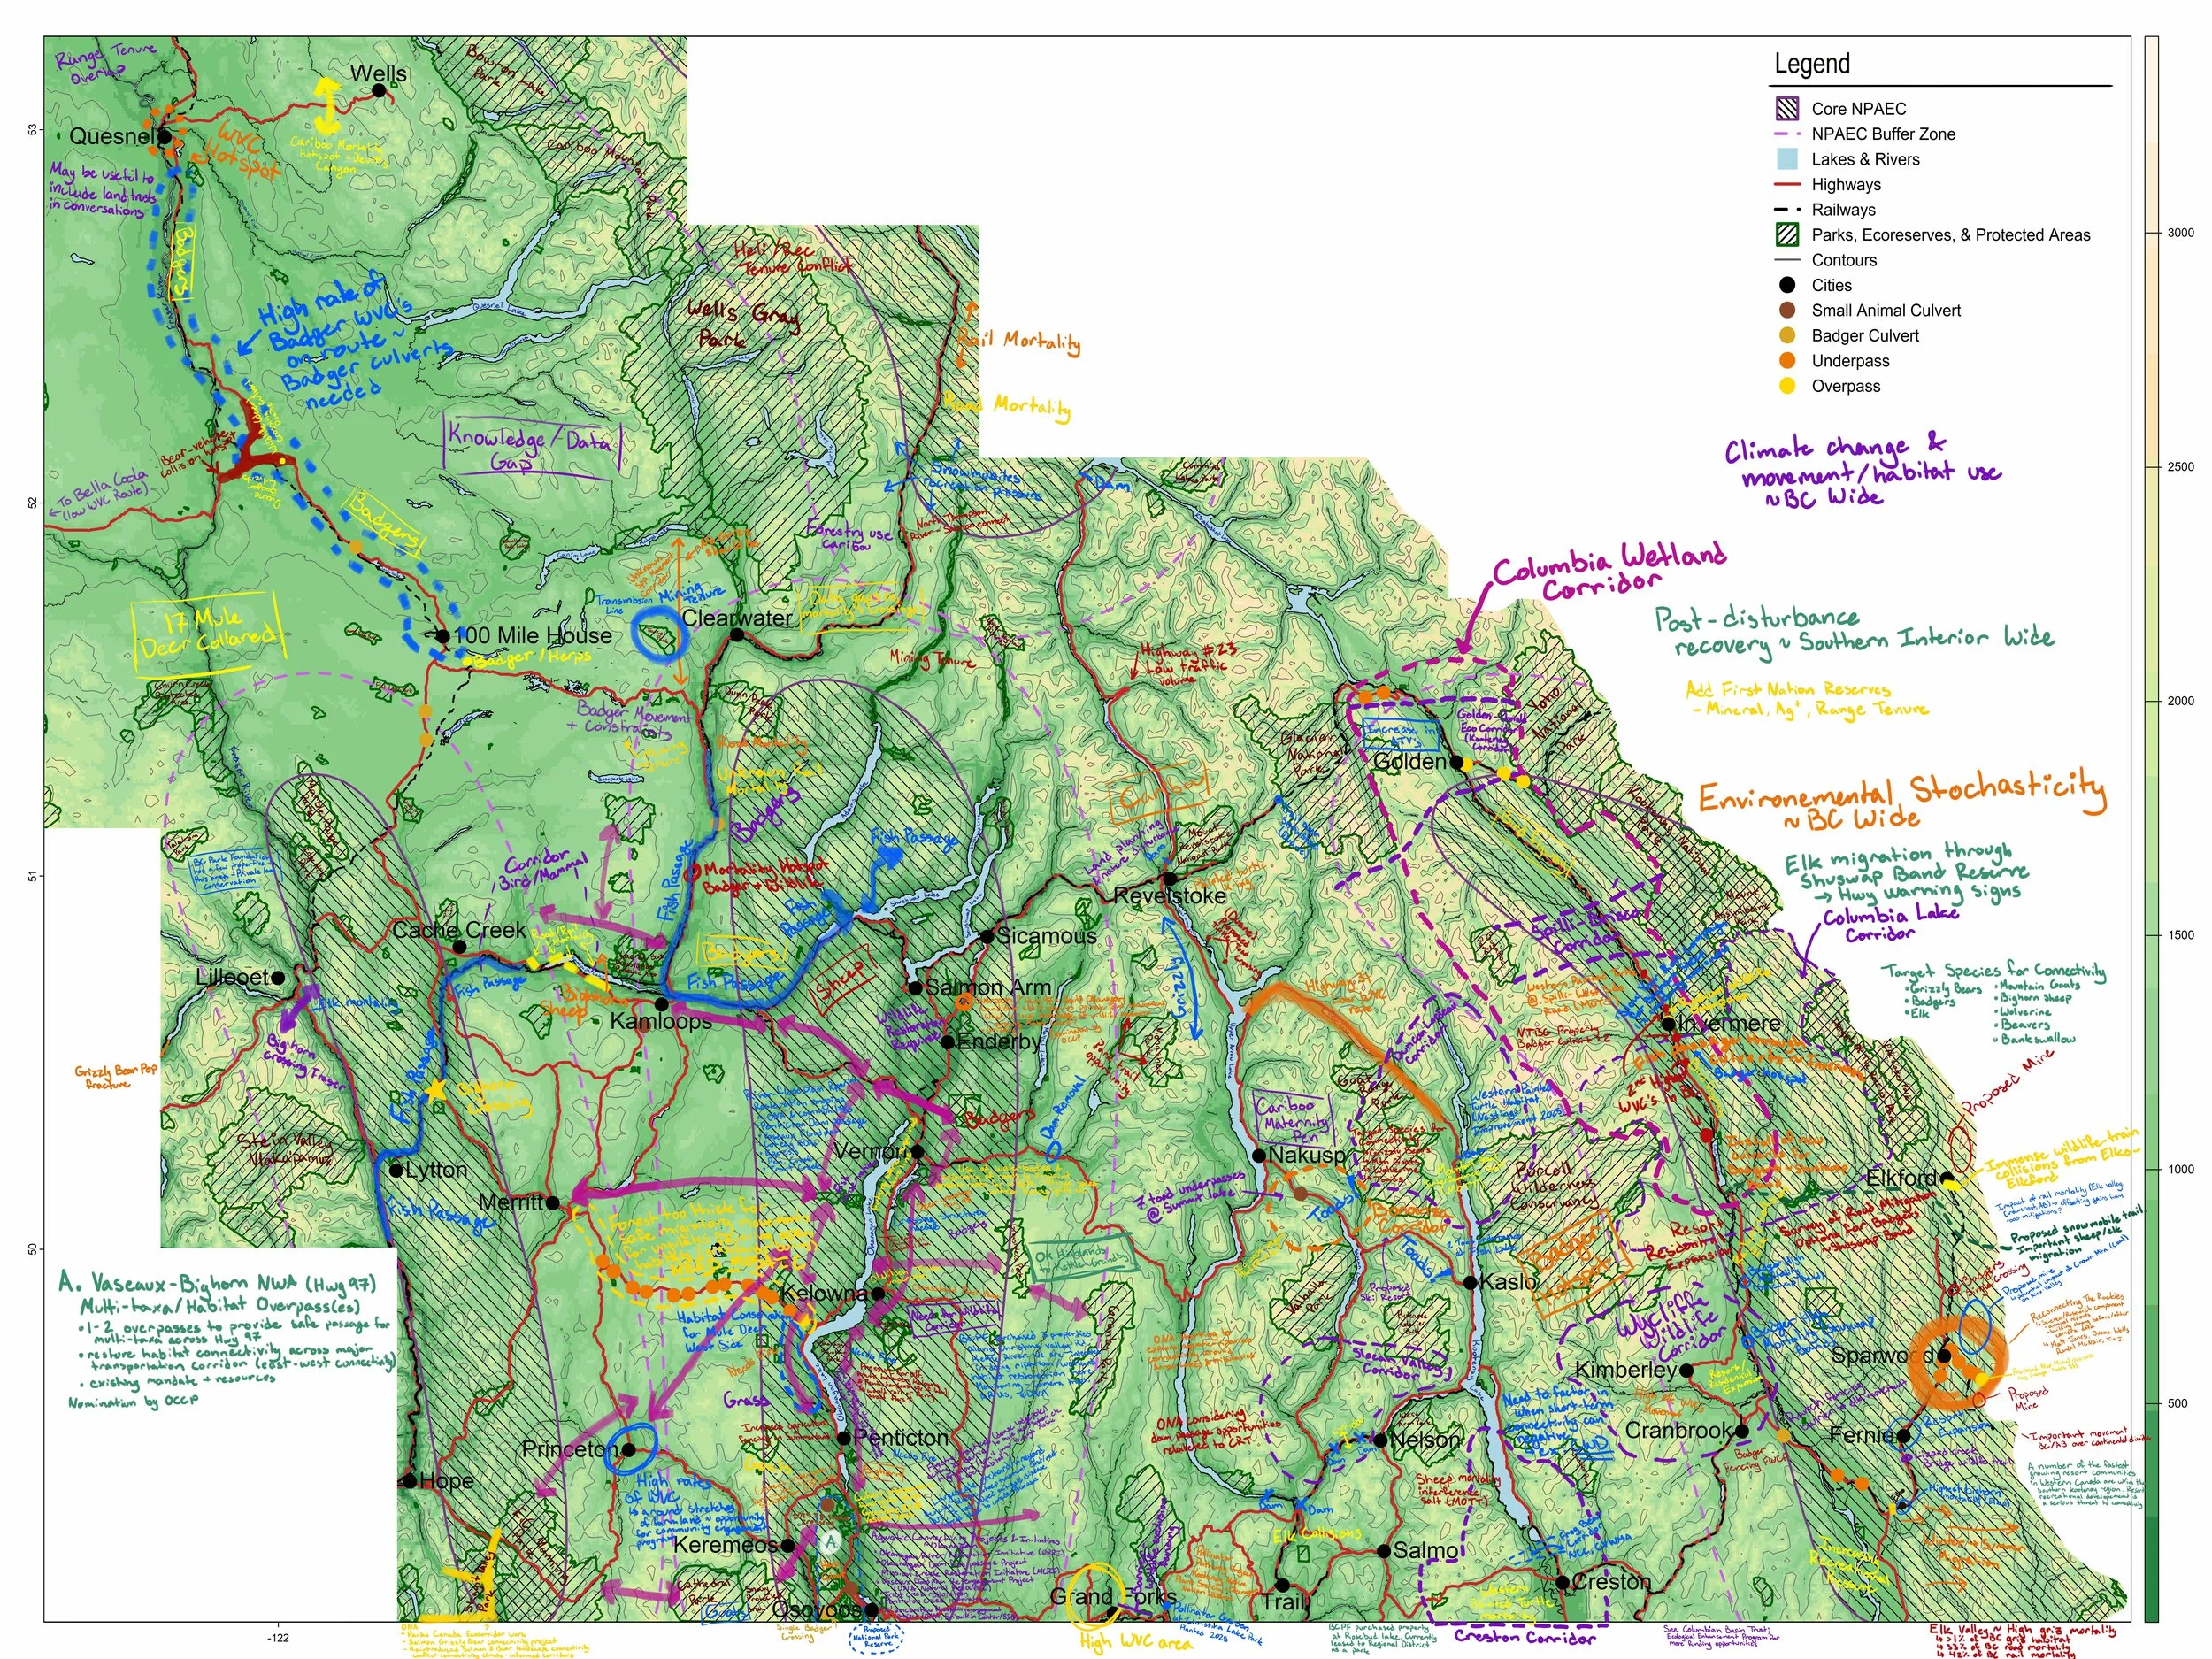
Detail of annotated map. Maps and GIS by Robin Blott.
Day two of the Corridors and Crossings Forum, Kelowna, June 2025. We'd just unrolled a set of large printed maps of BC's Southern Interior across the tables and put a handful of markers down beside them (background discussion paper that informed the forum can be found here). There was some unease, and then someone leaned in and started annotating, and within ten minutes every map had three or four people standing over it.
The setup was simple. The maps were based on the "caterpillar" corridors from Canada's National Priority Areas of Ecological Corridors (Canadian Geographic has a great interactive map). People could mark anything relevant. Wildlife corridors they were working on. Roadkill hotspots they knew about. Data gaps they were frustrated by. Areas of ecological concern. Markers were available. The map was open.
The maps left the room covered. Elk migration routes. Wetland corridors. Post-disturbance recovery zones. Notes about climate-driven habitat shifts. First Nations, NGOs, government agencies, and universities had layered decades of regional knowledge onto a few sheets of paper in an afternoon.
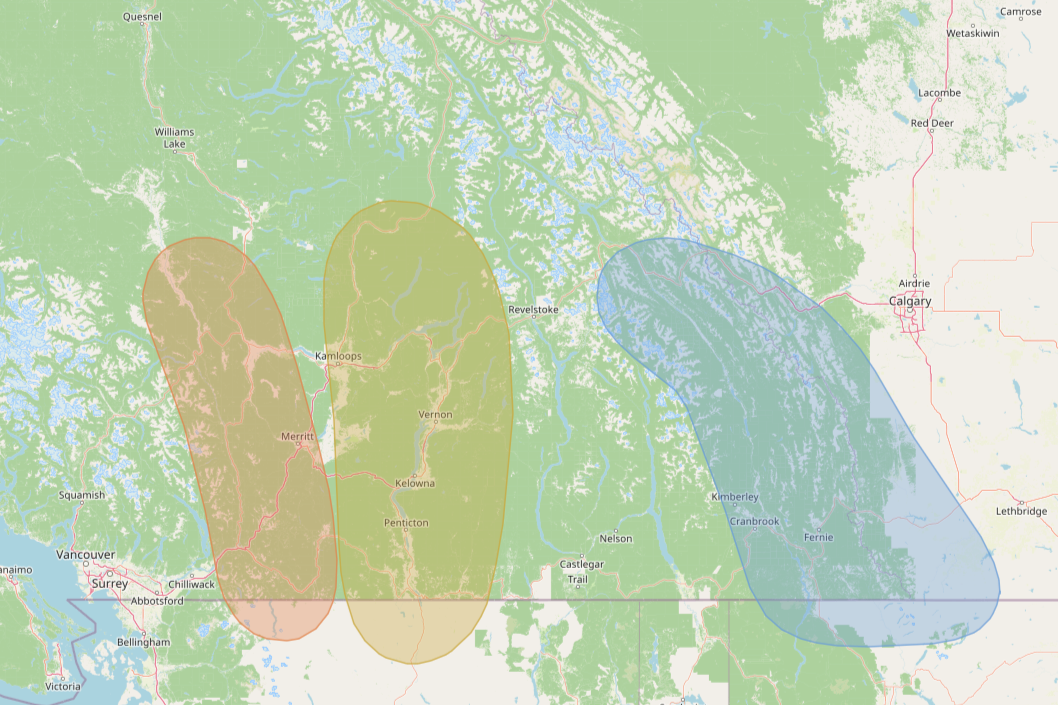
The three ecological corridors that were the focus of the workshop. From west to east: North Cascades to Fraser Plateau, South Okanagan to Thompson-Shuswap, Southern Rocky Mountain Trench.
The design choice that made it work
I framed the exercise as relationship-building, not data collection. Someone in the room push back on the framing, and that inspired an unplanned discussion on data sensitivity, Indigenous knowledge sovereignty and data sharing agreements. This discussion, initiated by someone steeped in traditional ecologic knowledge and the ethics of data sharing, built the foundation of trust by clairifying what I was expecting, and the purpose of the mapping exercise.
Some people in that room had formal authority over the land. Others were asserting rights to it. Others were trying to influence decisions from the outside. A data-extraction exercise would have collected information and undermined the actual purpose of the workshop, which was to build trust and open channels between people who don't usually share a table. The relationship-building frame produced something else. A shared place where people could contribute what they were comfortable with, on their own terms.
What it revealed about the room
No single organisation in that room held a complete picture, and everyone knew it. In fact, the Southern Interior is a puzzle, and everyone in that room had a piece. The pieces have to be shared piece by piece, in trust and in collaboration, so that the corridors that cross from one jurisdiction to another stay intact.
The knowledge we needed was already there. It just needed a process, and a place to go, so all of the pieces could find each other.
Watching what people chose to put on the map, and what they held back, was the most useful part of the day for me. The contributions told one story. The silences told another. Trust was present, but partial. People were willing to talk about their work in broad terms, less willing to commit specifics to paper.
That's not a failure. That's an honest starting point. The next pieces of the puzzle come later, and they come from the same place: the relationships we built in that room.
The craft question underneath it
Mapping exercises become extractive easily, and quietly. My job was to design the thing so that contributing felt like building, not surrendering. In this case that meant being explicit about what the exercise was not. Not a data grab. Not a planning document. Not binding on anyone afterwards. Once that was clear, people could engage with what it actually was: a chance to make their knowledge visible, to see others' knowledge alongside it, and to start to understand the scale of what a regional collaboration could hold.
The annotated map that left that room wasn't a dataset. It was a first draft of a shared understanding. That's what a good opening exercise produces. Not the answer. The first version of the question the group is going to spend the years ahead answering together.
Background: the discussion paper that informed the forum is [here]. Canadian Geographic has a useful interactive map of the National Priority Areas of Ecological Corridors [here]. Maps and GIS by Robin Blott.
How I Work: A first attempt at a process map
I have been reflecting on my facilitation practice recently. Something has been not quite right, and I am struggling to understand what the disconnect is. This is not about what I do, that's easy enough to summarize, but rather how I do it. The reasoning behind the steps.
This is my first attempt to answer that question: How do I work? How do I approach facilitation? I expect to revise the answers as I keep thinking, but I wanted to use this space to voice some inner thinking, to bound ideas off the internet.
In total, I think there are seven elements. Not steps in a linear process, but more like questions to ask, each one conditioning the next.
1. Conditions Assessment
The first thing I do before any engagement isn't design a session. It's to ask whether this engagement makes sense.
Do my values align with the work being proposed? Are the conditions right for good work? Is the question real? Are the right people in the room? And is there alignment between what I'm being asked to do and what this process can honestly deliver?
That last one is the hard question, and it doesn't always have a comfortable answer. I've been asked to design processes where the outcome was, functionally, already decided, where the process existed to give a decision the appearance of legitimacy. That work no longer interests me, if it ever did. Values misalignment at the front end is a stop sign, not a speed bump.
I don't always get this right. Sometimes you don't know what you've walked into until you're already in it. But the practice of asking these questions before the contract is signed is an important step that has saved me more than once.
2. The Contract
There are several points along the way where there is a “contract”. Not a contract for employment as in signed agreement outlining what I will do for the client. Rather, an understand between the people I am working with and I. This understanding is more then words on a page, more than the outcomes listed in a Schedule A. This understanding is about how we will work together; how we will move through a complex and sometimes contentious process in a manner that is supportive, open and critical.
The first understanding is with the steering committee or organising body. Our expectations must be in alignment, and we work to ensure that the outcomes they are seeking align with the people we invite and the process we develop.
The second is with the participants. The opening establishes why we're here, what the stakes are, and what I'm inviting people into. I'm not there to lead them somewhere, I'm there to hold the conditions for them to do the work. A muddy opening produces a muddy session; you spend the day managing confusion instead of doing the work. When the opening is clear and genuinely compelling, you can feel it in the room within the first five minutes.
Both contracts are commitments I'm making. I'm telling people what kind of process this is.
3. Designing the Arc
A session is not a sequence of disconnected agenda items. It's a journey with a shape.
Where are we starting from? Where do we need to get to? What's the central question that everything else orbits? The middle of a well-designed session is where the real work happens, which means you must design for depth, not coverage. Depth is difficult to describe. It's the layers of understanding and trust that are built as you move through the opening portions of the agenda. Is the room safe for people to open up? Do we all understand the problem we are trying to address?
This is the part of the work I find most absorbing. There's something genuinely satisfying about building a process with a through-line, where each piece builds upon the next, where the close feels inevitable in retrospect. I spend more time on arc than on anything else in the design phase.
4. Presence
I stay in the room. Always within sight. I read the energy.
This sounds obvious, but it isn't. There are facilitators who manage the agenda and facilitators who hold the room, and those are different jobs. Managing the agenda is useful. Holding the room is the work.
Holding the room means being willing to intervene publicly when the conversation needs it — to name what's happening, redirect, slow down, or stop. It means trusting your read of the group even when the group is pushing back. It means not disappearing into the background when things get uncomfortable.
I've had sessions where I didn't do this well, where I deferred to someone with more positional authority than I had, and lost the thread as a result. I learned something from each of those instances. Presence isn't a personality trait. It's a practice, and it requires conditions: clear values alignment going in, and enough confidence in your own authority to use it when it matters.
5. Collecting Thunder
This is the one I have the hardest time explaining, so bear with me.
The close of a session is the most important part. Most facilitators, including earlier versions of myself, treat the close as a logistical task. Wrap up the flip charts. Assign the action items. Thank everyone for their time.
I've been trying to do something different, to build the close during the session by collecting the pivotal moments, the quotable statements, and reflecting them back to the group. By describing the arc that we’ve been on together.
Throughout the day, I'm listening for the moments, the phrases, the breakthroughs, the vulnerabilities, that belong in the close. When someone says something true and important, I note it. When the room shifts, I notice that too. By the time we're in the final stretch, I have material. Something to work with. Not a summary of what happened, but the shape of what it meant.
6. The Witness
The close I'm building isn't a recap. It's closer to a story.
When I close, I return to the contract and seek to remind people of where we started, the shape of the journey, and what it means moving forward. In speechwriting it's called inclusio; a rhetorical device where a piece opens and closes with the same word, phrase, image, or idea, creating a frame that makes the whole thing feel complete and intentional. The ending doesn't just finish; it echoes the beginning, and that echo gives the whole structure meaning.
I try to experience the work in a way that makes people feel seen: like they just participated in something that will matter.
Then, and only then, the logistics.
I think a lot about this element. It's where facilitation most closely resembles ceremony. The point is that it requires a different quality of attention than the rest of the day, and it can't be improvised. It has to be built by collecting thunder all session.
7. What Comes Next
A single session is rarely enough for the problems I work on.
Multi-interest conflicts, governance questions, relationships between peoples — these don't resolve in a day. They need time, repeated contact, the slow accumulation of trust. Good process compounds. One honest conversation opens the door for the next.
So part of what I'm designing for, always, is continuity. How does this session set up the next one? What relationship are we building that will carry the work forward when the formal process ends? A well-designed close isn't just the end of the session — it's the beginning of whatever comes after.
That's seven elements. The method is only as good as the reasoning behind it, and the reasoning is only as good as the values underneath. Conditions assessment, the contract, presence, the witness — none of those mean anything if you're not genuinely committed to honest process. To the idea that people deserve to know what they're participating in, and why, and what it might actually change.
That's the practice as I understand it now. But that might change.
Six Weeks, Five Days, One Standard: What the Coal-to-Gas Process Taught Me About Working Fast
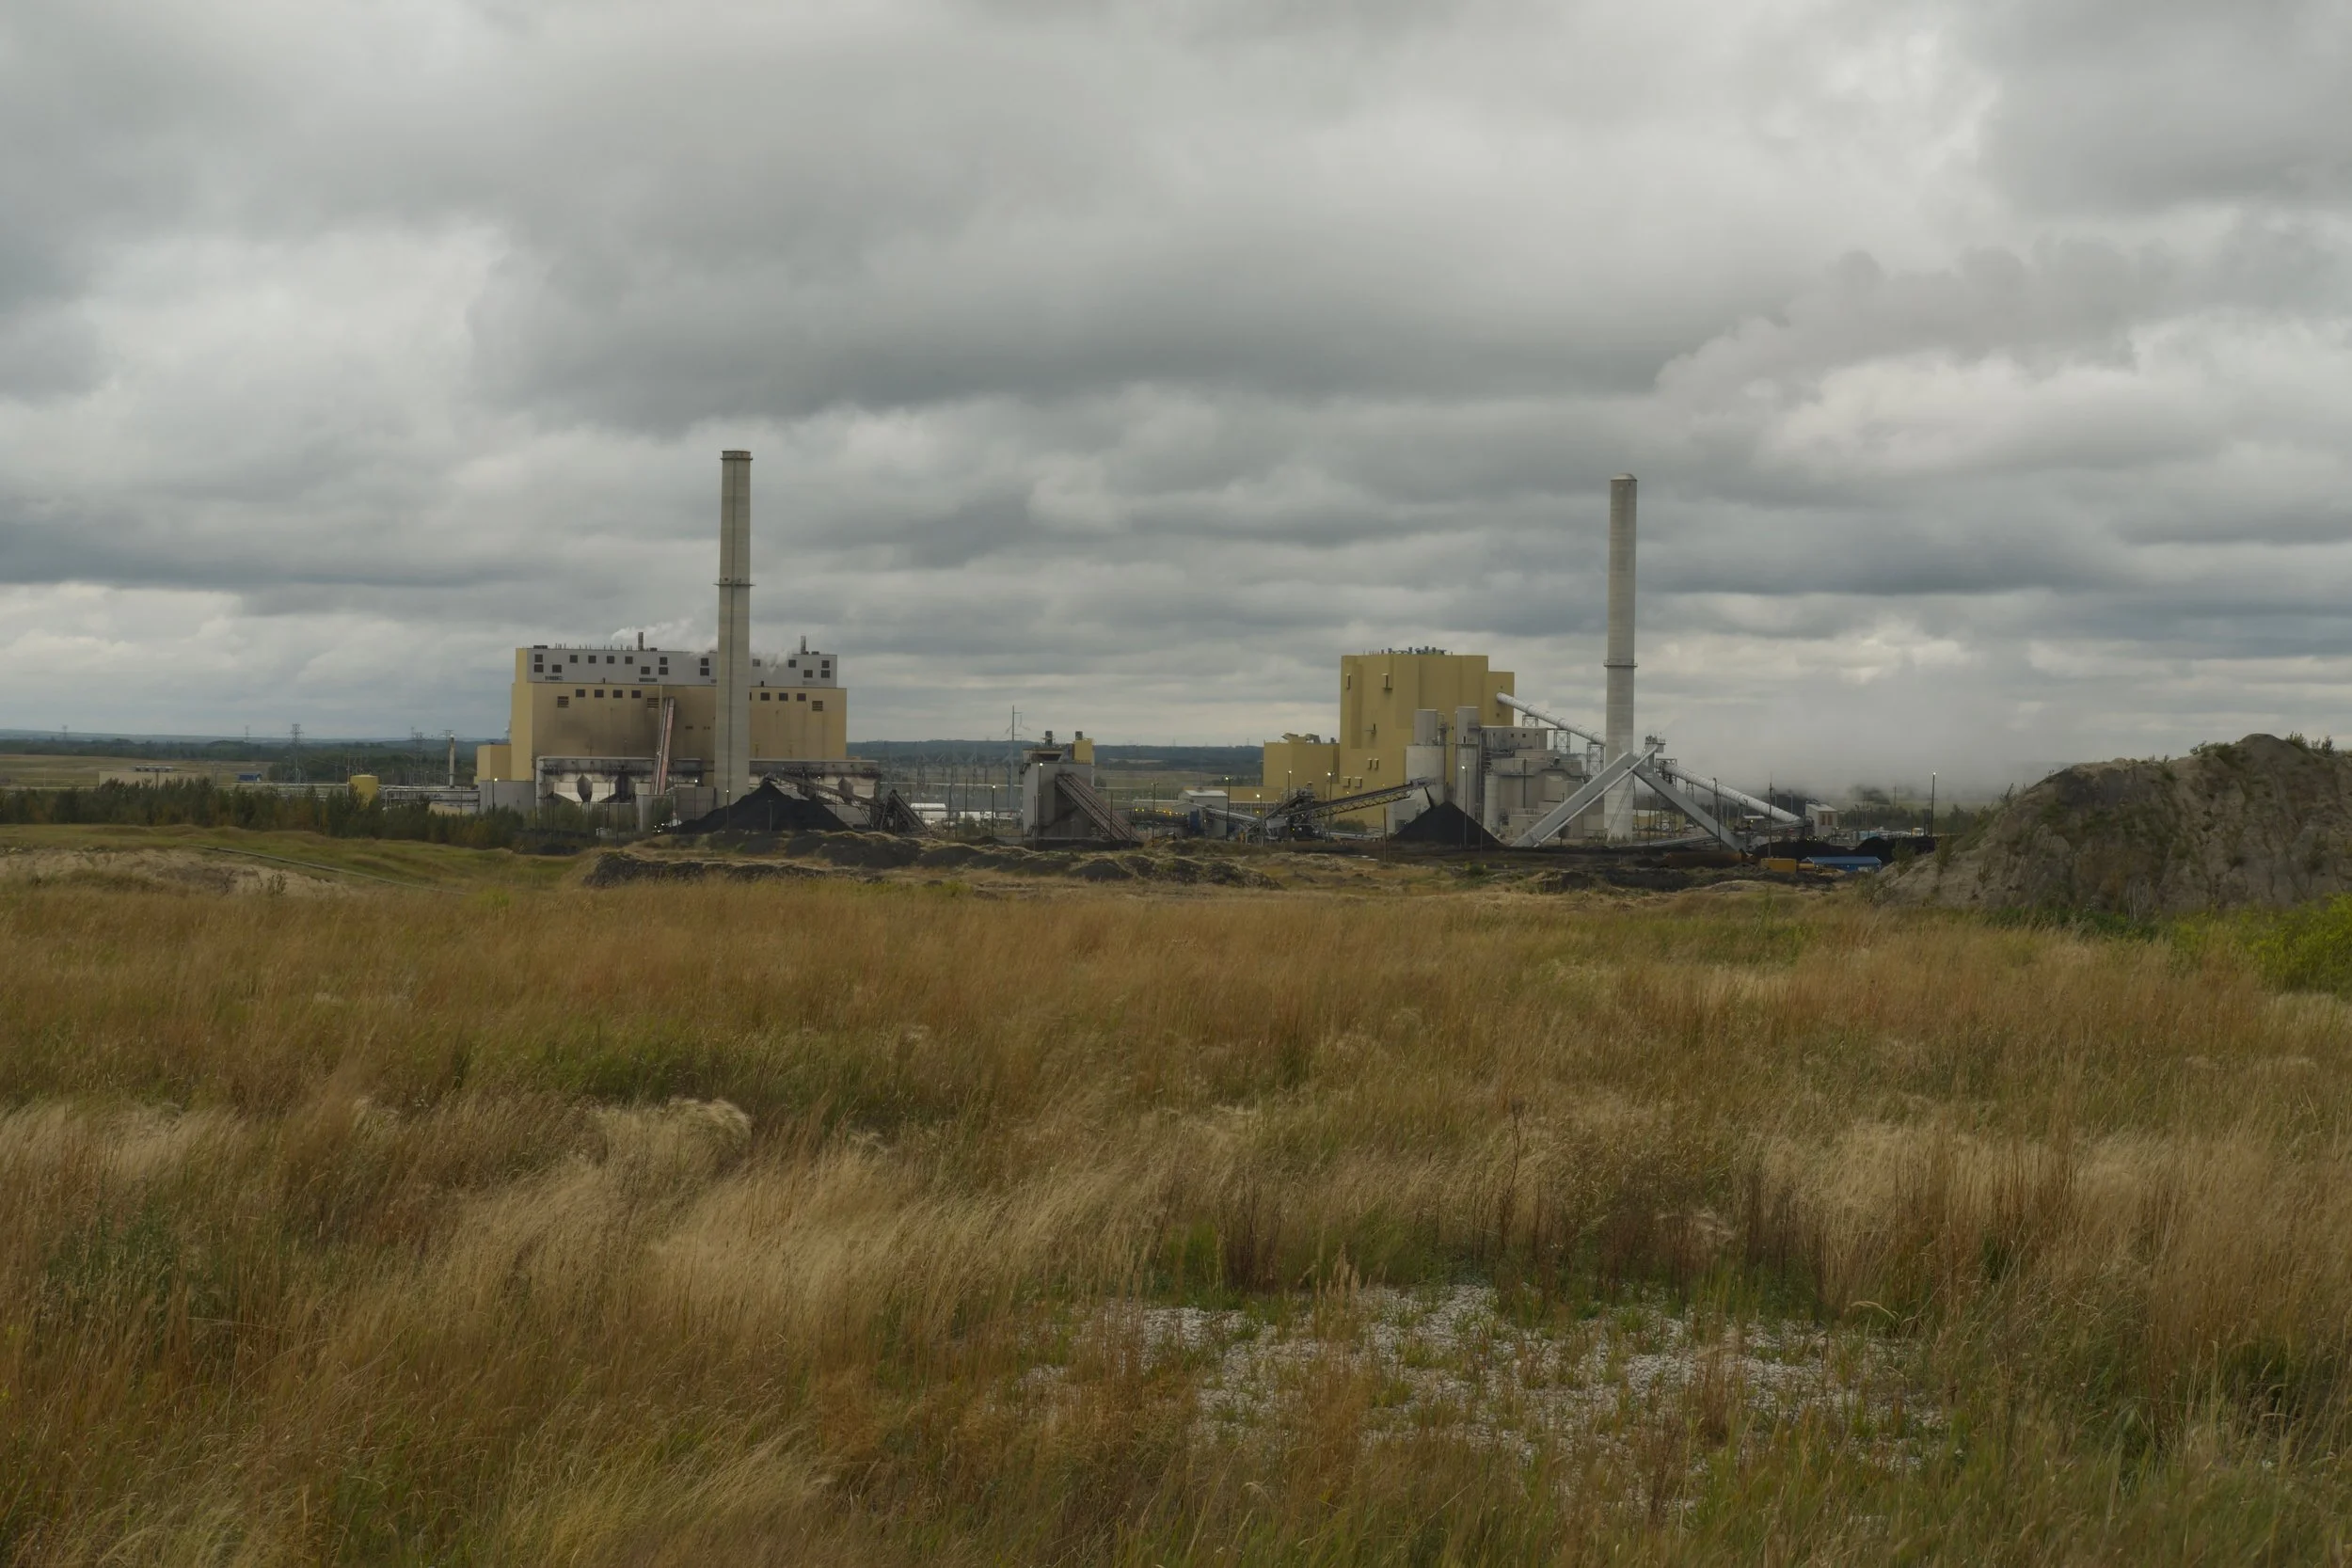
Keephills Electricity Generating Station, west of Edmonton.
In October 2017, Alberta's Deputy Minister of Environment and Parks sent a letter to the Clean Air Strategic Alliance with a simple request and a firm deadline: develop a NOx emission standard for coal-fired electricity units converting to natural gas. Have it done by December 31st.
The stakes were real. Utility companies were facing imminent investment decisions worth hundreds of millions of dollars. Environmental organizations had hard positions on what acceptable emissions looked like. And everyone knew that if the process failed, the government would simply impose a standard on its own.
I was the facilitator.
What followed was intense. The timeline was unforgiving and the technical complexity was real. The group had access to a third-party engineering report from Black & Veatch that laid out the performance possibilities for different conversion technologies - a coal-to-gas conversion had never before occurred in Alberta. My job was to help a room full of people with fundamentally different interests read the same report and find an emissions number they could all live with.
We met three times, for a total of five days, over about six weeks.
Before the first meeting, I worked through where this process could go sideways. Some of it was about people: who might disengage, who had a history of being difficult, who needed a phone call before day one just to feel heard. Some of it was about the political risk of a key stakeholder walking away and trying to kill the outcome at the board level, a real possibility when the stakes are this high. Some of it was about the process itself: whether people understood their own reciprocal responsibilities, and whether the scope was actually doable in the time available. For each scenario, I thought through a response in advance. Most of it I never needed.
The approach was interest-based throughout. Rather than asking people to argue from fixed positions, I kept pushing the conversation toward underlying needs: What does your organization actually need from this standard? What does a good outcome look like for the communities you represent? What are you genuinely worried about? Shifting from positions to interests is often where the space for agreement opens up.
The facilitation questions I brought into each meeting were designed to open that space gradually. In the first meeting, before anyone touched the engineering report, I asked people to describe their interests relative to the problem, not their positions. What criteria would they use to evaluate a good outcome? What did they need to be able to say yes? I used those answers to build a shared evaluation tool that the group could apply to the options Black & Veatch had laid out. By the time we got to meeting two, we weren't arguing about values anymore. We were using them as a lens to assess technical options. That sequencing matters.
By the time we reached the December board meeting, the working group had reached full consensus on a Coal-to-Gas NOx Emission Standard that set a 50% reduction below each unit's baseline emission rate, with a design target of 55%. Utilities, ENGOs, and the government all signed on. The CASA Board approved it. The Government of Alberta subsequently adopted it.
Five days of meeting time that resulted in one consensus recommendation.
The Coal-to-Gas process is a reminder of what becomes possible when the scope is tight, the stakes are clear, and the people in the room believe that the process is the only avenue available to them.
Sometimes constraints are a gift. When everyone knows there's no end run, they show up and do the work.