My egg is now up and running! I was able to easily figure out the instructions for connecting the AQE to my computer and applying a software fix to the AQE. The Vimeos for the fix can be found here. There are three components to the AQE that I really like:
- It's open sourced;
- The data streams are easily accessible in various formats;
- A Dashboard to access your data, and the data of those whom you follow.
Open Sourced Air Quality Monitoring

The above schematic is but one example of how the AQE people endeavor to make the framework for the egg as open as possible. Granted, it is an elite person who could go out and build one from scratch, but having everything that goes into the egg available on-line means that individuals can carve off a little section of the project that they can personally improve, and make it better. Perhaps you are not a hardware person, then you can build the software, or perhaps you want to establish a AQE community in your city, or maybe you want to shell out you 185$ to simply monitor the air outside your home. Whatever fits your mood.
Data is available
Granted, this is similar to Cosm's open hard- and soft-ware approach, but it is worth noting based on how accessible the data is. As a novice data user, I appreciate that they support basic graph making within their platform, and provide tools to embed your graph into a blog post, Facebook, or on Twitter.
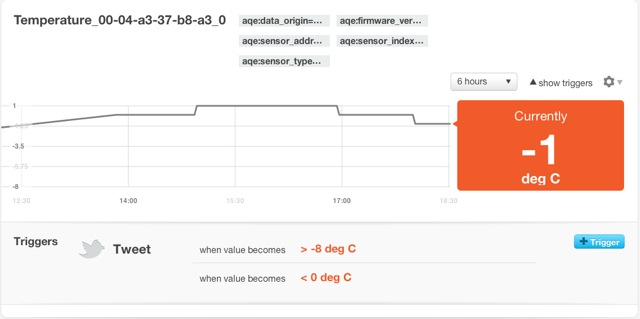
'Triggers' can also be created. A trigger is defines a set of criteria for the data to meet, and if those criterium are met, then a tweet is sent out via your account alerting you, and the world, to the pertinent information. From the image above, an alert will be sent out when the temperature is >-8C or <0C. A user friendly tool that alters you to user defined changes in the data stream.
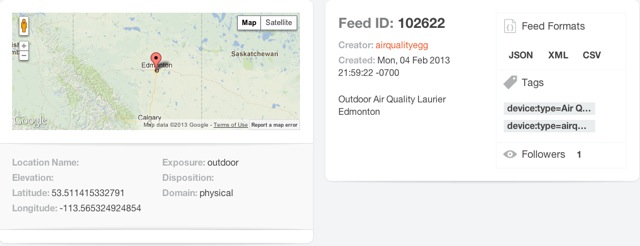
The data is also accessible via JSON, XML and CSV. While I am not capable of creating a data feed through JSON into, for instance, Excel, the feeds are available for those who are. I will, though, access the CSV function and compare the AQE feed with Alberta Environments NO2 feed for the City Center monitoring site. Coordinates for the AQE, Feed ID, and other information are provided clear and obvious.
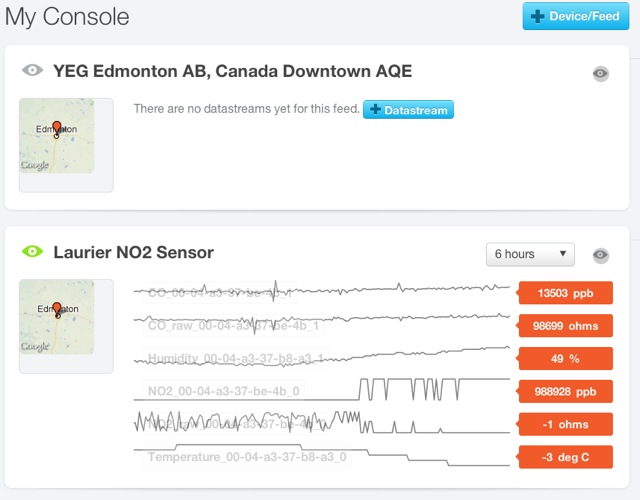
Dashboard or 'Console'
Finally, Cosm has provided a console interface to allow the user control over the data feeds that they follow, including API keys for each feed, and the ability to create apps. I have not yet explored the app feature to any extent, but I will report back when I do!
Finally, you can access and review the NO2, CO, Temperature and Humidity data that I am collecting from here.