Toronto Tweets
There is an emerging narrative that characterizes Twitter as a tool of public engagement that can augment more traditional means of consulting with the public (for instance, see here for Environment Canada's commitment to "...implementing more avenues to facilitate online connections with partners, stakeholders and interested members of the Canadian public") . While there is no doubt that there are many many people who use Twitter (it is reported that there are over 200 million active Twitter accounts) as a mean of conversing with their elected officials, it is important to remember that Twitter does not include all voices within our Canadian cities. This blog post is an attempt to understand who might, in fact, be Tweeting within Toronto in a effort to understand who might be Tweeting about Toronto. About this map

[mapbox layers='mattdance.toronto_tweets' api='' options='' lat='43.65969596299056' lon='-79.38002295227051' z='15' width='600' height='400']
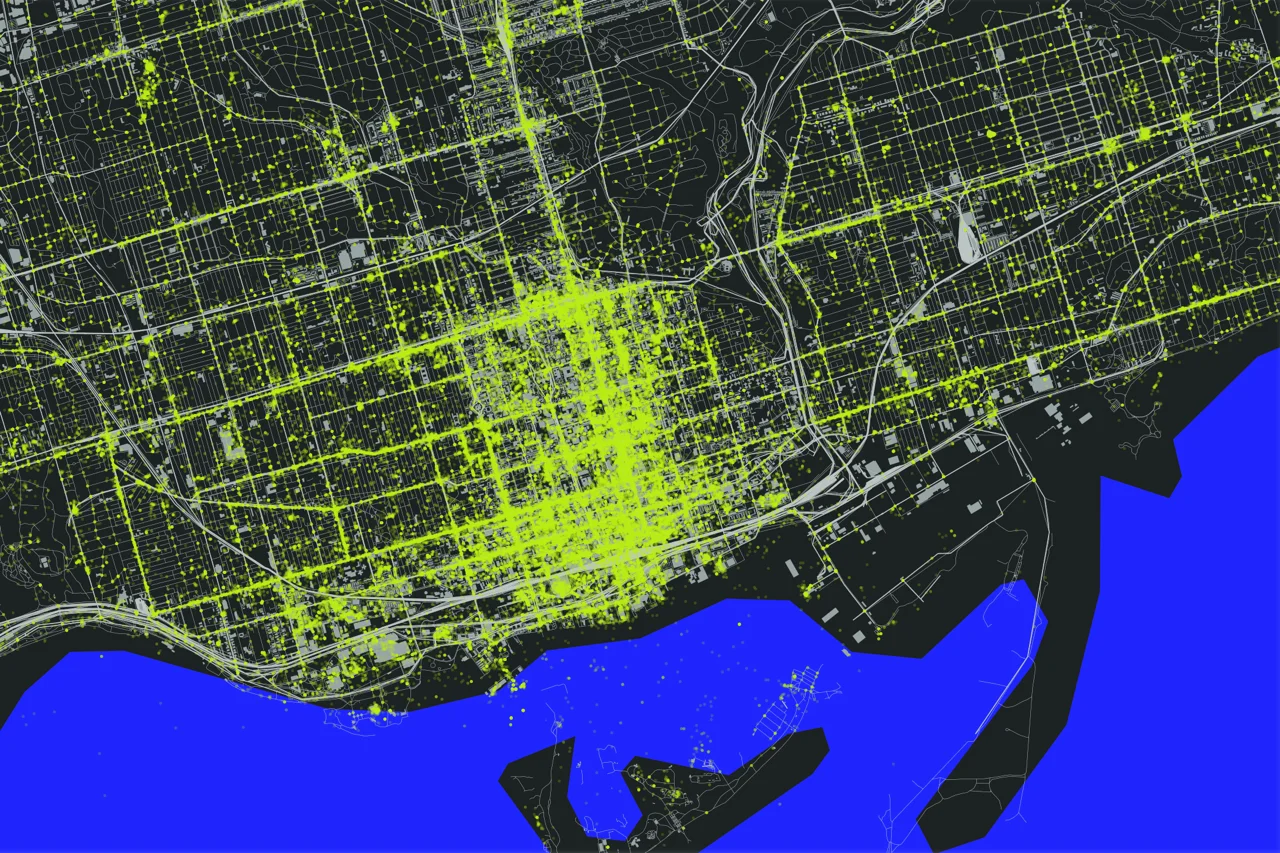
Above are Twitter maps of Toronto that represents all of the geolocated tweets for Toronto in 2011, about 1.5% of the total Tweets (in other words, 98.5% of Tweets are not location enabled). The Twitter data were provided by Trendsmap through John Barratt (thank you!). A full sized version of the dynamic map can be found on the Map Box site.
This was a challenging data to work with as it is so large. I started in QGIS to understand how the data looked and to pair it down to just tweets within the GTA. I moved the data into Tile Mill by Map Box, and layered Open Street Map data to provide visual context for the tweets. The 'heat map' effect that I used is described here, as I was not able to make the QGIS heat map plugin work, for some reason (please let me know if you can help with this). I plan on learning how to build a PostGIS database on my computer so that I can do this.
The idea for the map and post came from these three beautiful and interactive twitter maps: (1) London, (2) New York and, (3) Melbourne.
Observations and analysis
A closer look at the map reveals very dense Twitter areas and areas that are very sparsly Tweeted. The most densely Tweeted area is bounded by Bloor Street to the North and Lake Ontario to the South, connected by Young Street. There is a greater density along the Lake, away from Young to the West. There are also a small number of ghost Tweets on the lake North of Toronto Island.
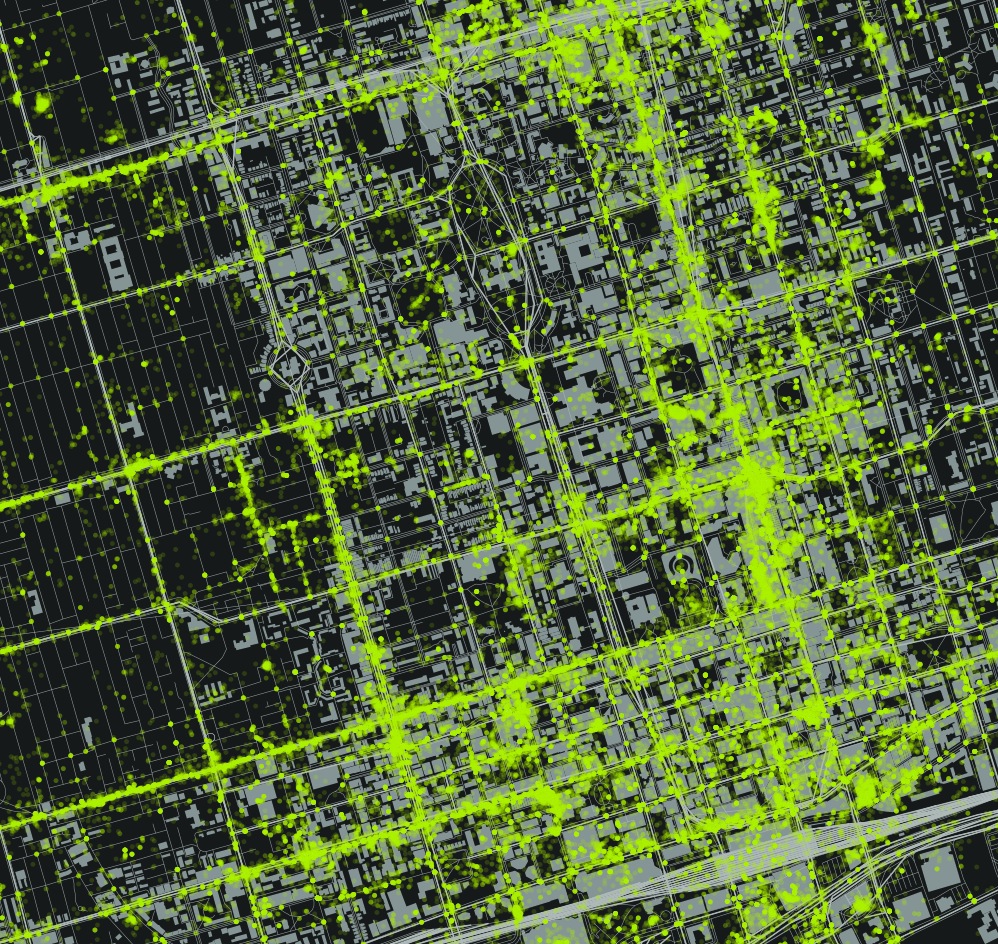
These boundaries are visible in the above image. There are also a couple of identifiable hot spots - the Eaton Center, Rogers Center (cut off in the above picture). The areas described by this Twitter Density also corresponds with the tourist and suburban destinations - the areas around Young - Bloor - and Front Street, including the sports stadiums, are not just neighbourhood destinations, but destinations for those interested in shopping or taking in the sights in Toronto.
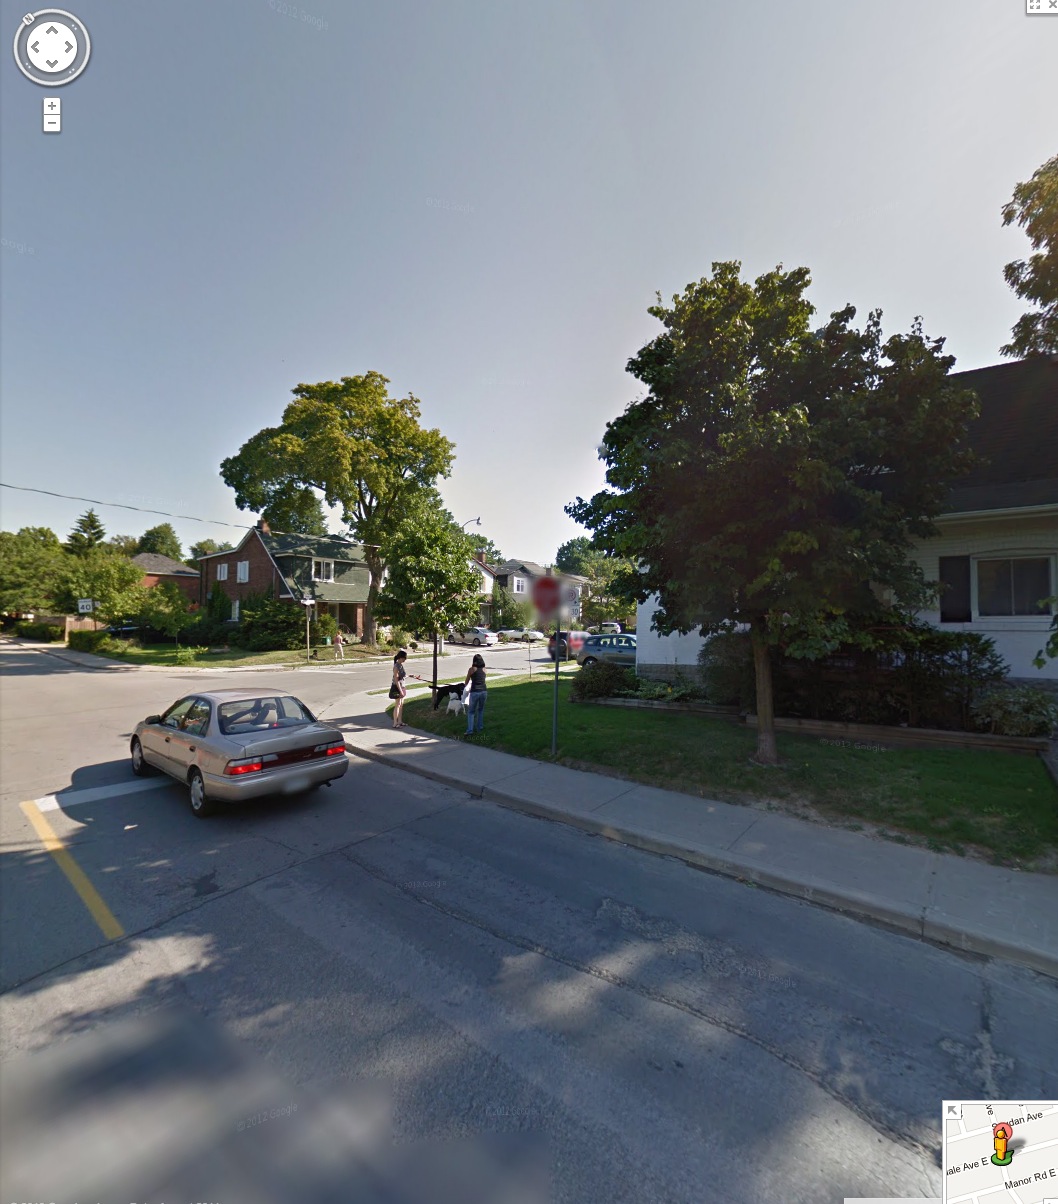
In contrast, those areas that are strictly neighbourhoods, such as Hillsdale Avenue (running east from Young) do not offer that same density.

The above example shows a middle class neighbourhood within Toronto that does not have a large number of Tweets other than the cluster at the corner of Young Street and Eglington Avenue in the top left of the image. The Mt Pleasant Cemetery bounds the neighbourhood to the South.
In addition, poorer neighbourhoods also seem to have a dearth of tweets. The following image is of the Regent Park area between Dundas and Gerrard.
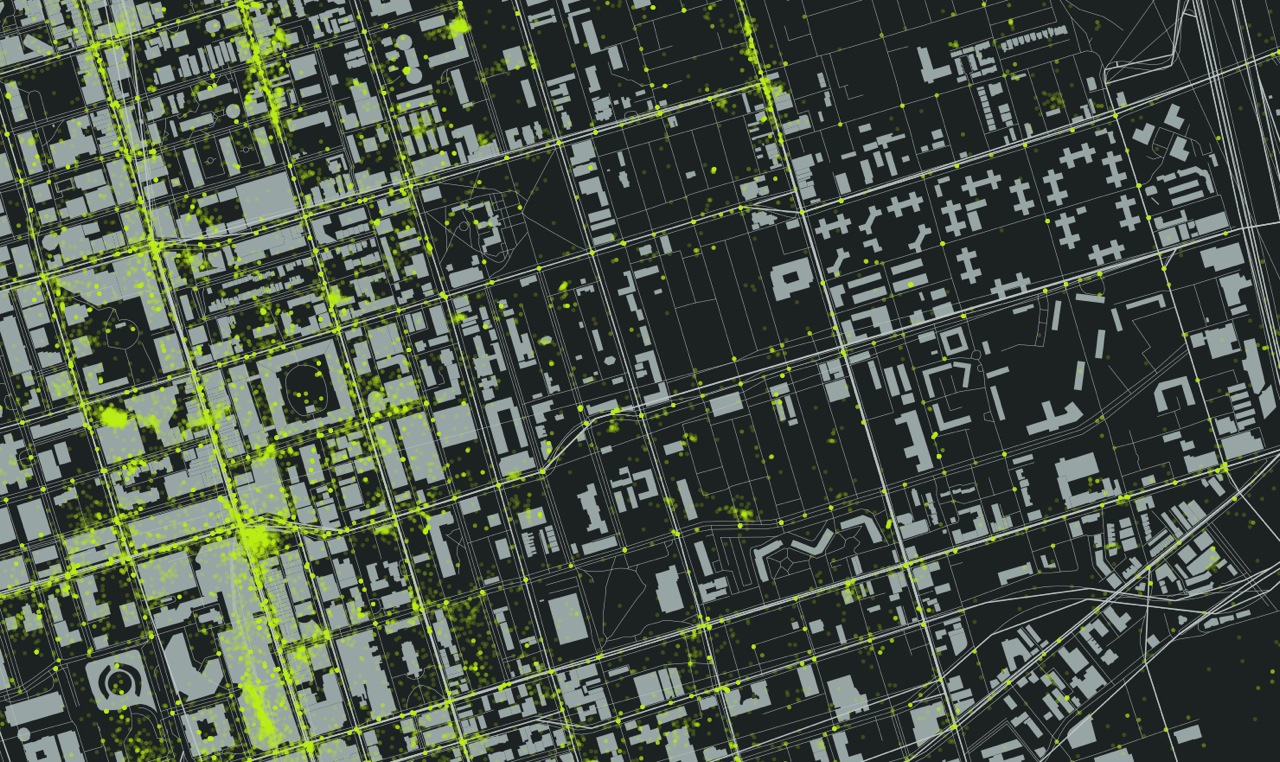
It is clear from the image that many people are Tweeting on Young Street. You can even see a hotspot in the Eaton's Center and at the south east corner of Young and Dundas. Further east, nothing. From the Regent Park Wikipedia page:
The average income for Regent Park residents is approximately half the average for other Torontonians. A majority of families in Regent Park are classified as low-income, with 68% of the population living below Statistics Canada's Low-Income Cut-Off Rate in one of its census tracts, and 76% in the other (compared to a Toronto-wide average of just over 20%).
Conclusions
I suspect that most of the Tweets that occur in Toronto are from those who live in the region, but who may be downtown for some shopping, to take in a game, or other recreation. I also suspect that a majority of those who live in Toronto are a small portion of the overall Tweets in the area between the Lake and Bloor, adjacent to Young.
As you move from this area, I suspect that a greater portion of Tweets are made by residents of those neighbourhoods, simply because fewer 'tourists' would travel to these neighbourhoods unless there was an attraction, such as shopping or food. Although I am only exploring those ~1.5% of tweets that are geolocated, I feel that these are the Twitter users who are most likely to engage with an Open311type of application, to use their smart phones as a means of communicating location details to their municipality. If this is the case, then those poor areas of the city, potentially the most disenfranchised, will become more so (look at Mark Graham's work mapping the digital divide in Francophone Africa).

Where do accidents happen?
There is currently some debate in Edmonton regarding bike lanes, and the inconvenience that they will provide to drivers. In particular, Mayor Mandel was quoted as saying:
Not that they’re not a good idea, but it just seems someone behind your scenes out there has just decided we’re going to eliminate all vehicles and only have bikes.
In response, I wanted to look at the number of interactions that cars have with bike or pedestrian in Edmonton. The data.edmonton.ca portal had the appropriate data from 2010 - intersection collisions here, and midblock collisions here. I sorted the data for pedestrian and bicycle collisions with vehicles, and I included all data for bikes and pedestrians, regardless of who was deemed to be a fault. I loaded the CSV data into Cartographica, a lightweight Mac based desktop GIS, and used OpenStreetMap as the base layer for Edmonton. The results are below, captured as an image (I will work with someone more capable that me to check the data and to get it on line in an interactive format). Legend: red/yellow diamonds are intersection collisions, blue/blue diamonds are midblock collisions. The numer adjacent to each diamond represents an aggregate of pedestrian/bicycle interactions with motor vehicles. .

Some things to note:
- More collisions happen at intersections (90 in total) than midblock (22 in total).
- The most dangerous intersection in 2010 was Fort Road and 66 Street, with 4 collisions.
- The most dangerous stretches of road were Gateway BLVD north of 51 Ave, 109 Street north of Whyte, and Calgary Trail north of 34th Ave.
- Midblock collisions saw 18 pedestrians and 4 cyclists injured.
- Intersections saw 65 pedestrians and 27 cyclists injured.
Conclusions
There is a greater safety issue at intersections where advanced pedestrian and cyclist activated lights should be installed in conjunction with bike lanes. Furthermore, if the bike lanes are being considered for safety reasons, residential street speeds should be lowered from 50 km/hr to 30 km/hr. There is convincing data that cars travelling slower inflict less damage than tose travelling faster - see this WHO report [PDF].
Finally, if the City of Edmonton were serious here, they could conduct an interesting study to track accident rates with cyclists and pedestrians give the introduction of bike lanes, intersection controls and low residential speed limits.
Thesis Musings
The Point
I just completed my MA in Human Geography. My research pertained to people's understanding of location and their communication of that understanding through emerging location based technologies. My entire thesis can be access here (be warned, it is a large PDF via Google Drive).
In an effort at transparency, the next series of blog posts will examine some of the data that I collected pertaining to place and space, and the communication of that understanding through the tools of neogeography. These posts will draw upon two sources of data; mental maps that my research cohort drew, in conjunction with descriptions of the places represented in their mental maps. I will start by framing the discussion with place, space and mapping concepts.
Please note: The University of Alberta’s Arts, Science, and Law Research Ethics Board granted permission for me to post sections of interview transcripts to personal blogs, as did each informant. Any names that are referenced are pseudonyms.
Place and Space
The notion of 'place' is a common descriptor of the world, and is a central theme in the study of geography (Relph 1976) and other social sciences such as sociology and psychology (Gieryn 2000). These various disciplines characterize and describe place in a variety of ways (Harrison 1996); for the purpose of this study, place is defined as being comprised of three dimensions (after Relph, 1976):
- Observable activities that occur in relation to the place
- The meanings that are created by a person in that location, and;
- The physical features that comprise the location's concrete or tangible attributes.
A place is comprised of its physical characteristics, the activities that occur there and the meanings derived thereof (Devine-Wright 1997). The more familiar a person is with a place, through experience (for instance, through recreational or sporting activities), the greater the meaning that place is likely to have (Lynch 1995).
Maps
Maps are a common metaphor used to describe place (Zook 2007) where simple points on the map represent a much more complex reality. Lynch (1960) views place as a series of connected locations where individuals mentally organize their spatial environment in predictable ways around five elements (see below). Lynch's view of place implies that linkages exist between places based on a person's experience with those locations, creating a tapestry of meaning imposed upon an urban landscape. Similarly, (Tuan 1977) differentiates place from space based on the familiarity a person might have of the former; as a space becomes more familiar, more intimately known, it is transformed into a place. `If space is movement, then place is pause' (Tuan 1977, p.6).
Maps are one tangible way of conceptualizing and representing place and space. Modern maps, such as atlas and road maps, are mass-produced for a consumer market, and are the result of painstaking work done by experts in the fields of cartography, air photo interpretation, statistics, and other disciplines. One of the goals of a modern map is to communicate an objective representation of place that is accurate, useful and that conveys a sense of that place (Taylor 2009). For instance, a map of a city may convey a sense of place by rendering a collection of place names (buildings, roads, plazas, etc) overlaid on a road network, on top of topographic features.
While a map-reader may get a sense of that place, via those representations, the map does not convey the deeper understanding of place that comes from everyday experience, meanings and associations that a resident may possess. In fact, maps may distort a local knowledge by misrepresenting the meaning of place as reflected by, for instance, place names (Frank 2000). In this instance, expert knowledge of map-making is not enough to produce maps that convey an accurate sense of place. The missing ingredient is the experience of a place that can only be gleaned by visiting, or perhaps by interacting with someone who has intimate knowledge of it.
One outcome of this central and authoritative communication of place, via consumer maps, is that citizens are relegated to the role of consumers to be consulted by experts (i.e. urban planners, academics) in their quest to understand what a place means to people. Tools such as cognitive mapping (Kitchen 2009) and mental maps (Lynch 1960) are traditionally utilized to mine these location data from individuals. Tversky (1993) defines cognitive mapping as the process of mentally acquiring, storing, recalling, and decoding metric information relative to location. Mental mapping is the non-metric capture of spatial relations among elements, allowing reorientation, spatial inference and perspective taking (Downs 1977). The importance of these concepts is that they rely on an individual's non-expert or lay, understanding of space. Indeed, the academic notion of Naïve Geography (Egenhofer 1995) is predicated on a `common sense' understanding of geography, where the focus is largely on the non-expert.
The descriptions of place gleaned from the cognitive, mental or naïve are the result of an individual process of understanding. While there are shared map elements between people (e.g. most people will recognize a 'cross' as being the location of a church on a map), these shared elements do not represent a shared experience or the basis of a common understanding within a community. Within this context, there are a variety of ways that an individual or community can understand place, maps being one.
References
Devine-Wright, P. and Lyons, E.: 1997, Remembering Pasts and Representing Places: The Construction of National Identities in Ireland, Journal of Environmental Psychology 17, 33–45.
Downs, R. M. and Stea, D.: 1977, Maps in Minds. Reflections of Cognitive Mapping., Harper and Row.
Egenhofer, M. J. and Mark, D. M.: 1995, Naive Geography, in A. Frank and W. Kuhn (eds), Spatial Information Theory: A Theoretical Basis for GIS, International Conference COSIT ’95, Vol. 988 of Lecture Notes in Computer Science, Springer, Semmering, Austria, pp. 1–15.
Gieryn, T.: 2000, A Space for Place in Sociology, Annual Review of Sociology 26, 463–496.
Harrison, S. and Dourish, P.: 1996, Re-place-ing Space: The Roles of Place and Space in Collaborative Systems, Proceedings of the 1996 ACM conference on Computer Supported Cooperative Work, CSCW ’96, ACM, New York, NY, USA, pp. 67–76.
Kitchen, R. M.: 1994, Cognitive Maps: What they are and why we study them?, Journal of Environmental Psychology 14(1), 1–19.
Lynch, K.: 1960, The Image of the City, The MIT Press.
Lynch, K., Banerjee, T. and Southworth, M.: 1995, City Sense and City Design: Writings and Projects of Kevin Lynch, MIT Press.
Relph, E.: 1976, Place and Placelessness, Pion.
Tuan, Y.: 1977, Place and Space: The Perspective of Experience, University of Minnesota Press.
Tversky, B.: 1993, Cognitive Maps, Cognitive Collages, and Spatial Mental Models, in A. U. Frank and I. Campari (eds), Spatial Information Theory: A Theoretical Basis for GIS, Proceedings COSIT ’93, Vol. Lecture Notes in
Computer Science, Springer: Berlin, pp. 14–24.
Zook, M. A. and Graham, M.: 2007, Mapping Digiplace: Geocoded Internet Data and the Representation of Place, Environment and Planning B 34(3), 466–482.