For many reasons the Air Quality Egg represents a profound shift from the current regiem of regulator controlled Air Quality monitoring Specifically, the current model of AQ monitoring sees a regulator (government) define the AQ issue, the substances of concern, and the monitoring response to these top-down defined concerns. The AQEgg turns this model on its head by allowing, though citizen lead (though still early adopter) monitoring technology that is accessible to those who can afford a $185 sensor, or have the knowhow to build their own via 3D printers and electronic schematics. In other words, the model shift from top down to bottom up where a citizen, or group of citizens, can define where monitoring should occur. As detailed in this post, the current AQ monitoring network focuses on a regional level of air quality. For instance, there are three sensors in Edmonton that provide a regional overview of the air quality through a metric called the Air Quality Health Indicator. Southern and Western Ontario have a total of 15 stations (see map below) that provide air quality data for over 6 million people.

The AQ Egg provides three distinct advantages:
- They can be located at street level more easily. We really have no idea what is happening on street level and that the numbers may be well above what the regional AQ network reports.;
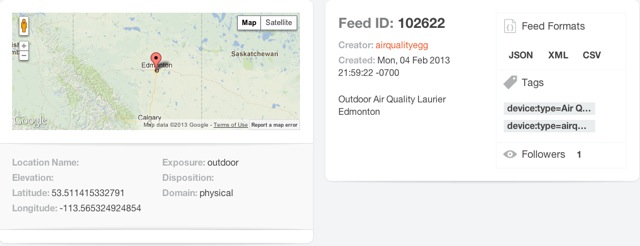
- The map provided my COSOM is more interactive and open. In fact, developers have already started developing products in support of the AQEgg. See the Air Quality Egg Helper Chrome extension;
- The AQ Egg data are open and available for download and analysis. This open data philosophy is not consistent across all regulators.
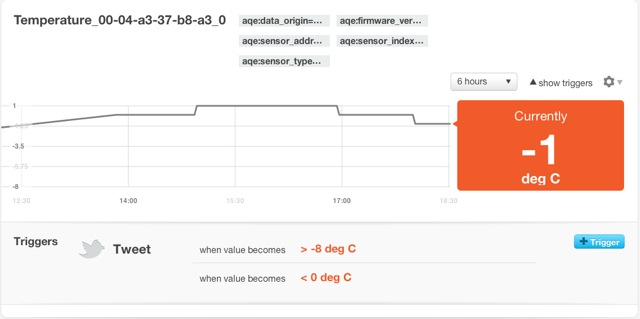
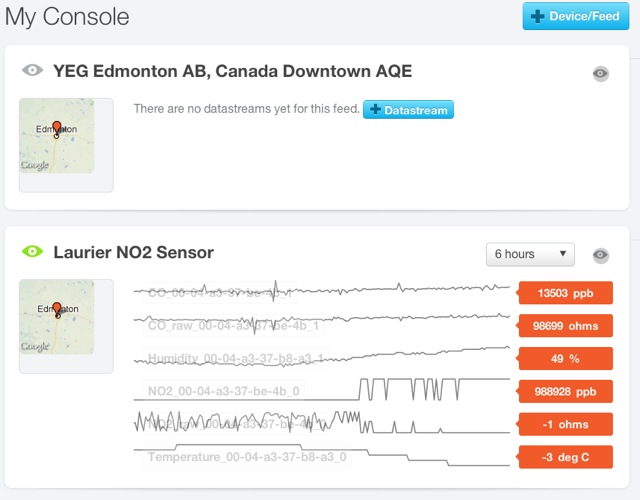
The one big advantage of regulator monitoring is the quality of the sensor, and thus the data where the measure of a sensor is the quality of the data it provides. As stated on the AQEgg wiki "...more work is really needed to make the low cost sensors sensitive to ambient pollutant concentrations." This can be seen in the sensitivity of the NO2 sensor as compared to actual ambient concentrations. In Vancouver, for instance (from the 2011 Lower Fraser Valley Air Quality Monitoring Report [PDF], pp. S-9) the annual average NO2 goal for Vancouver is 40 ug/m3 or less, with the one hour range being up to 122 ug/m3. The range of the NO2 sensor is 94 - 9400 ug/m3, less sensitive than the 'normal' ambient concentrations as detected by the regulator sensor.
Furthermore, the quality of the data is confounded by cold (an issue where I am from in Edmonton), and humidity. Regulator sensors heat or cool the air feed to a standard temperature and strip out any humidity to create a 'clean' sample.
My next post, hopefully coming soon, will examine some of the initial data generated by the AQEggs as compared to the regulator data.